
1 Introduction
The global emergency caused by the COVID-19 pandemic in early 2020 required national lockdown measures across the world, primarily targeting human activity. In the United Kingdom, construction and transport were allowed to continue, but a decrease in activity was observed (Hadjidemetriou et al. 2020). In other countries, such as Italy, the restrictions were more severe and even included limiting people’s movement to a certain radius from their place of residence (Ren 2020). The explorations in environmental acoustics of lockdown conditions across the world have revealed various degrees of impact on the acoustic environment, with researchers reporting reductions in noise levels affecting the population at the scale of urban agglomerations such as Ruhr Area in Germany (Hornberg et al. 2021) and conurbations in the south of France (Munoz et al. 2020). Impacts have also been reported at a scale of a multimillion city such as Madrid (Asensio, Pavón, and Arcas 2020) or Barcelona (Bonet-Solà et al. 2021) as well as at a more local, city-center or even public space-scale in cities such as Stockholm (Rumpler, Venkataraman, and Göransson 2021), London (Aletta et al. 2020), Girona (Alsina-Pagès, Bergadà, and Martı́nez-Suquı́a 2021), or Granada (Vida Manzano et al. 2021). In general, these studies have demonstrated a decrease in urban noise levels and indicated a difference in the amount the level decreased depending on the type of space investigated (e.g. parks, urban squares, etc.) and the type of human activity characteristic for the space, with higher reductions in places typically associated with human sounds and activities such as shopping and tourism.
Those studies were mostly focused around the L_{Aeq}, as well as a standardization approach to reporting subsequent changes in soundscape proposed by Asensio et al. (2020). They were not able to reveal the perceptual impact of such conditions in public spaces also because of: 1) the lack of subjective data for the exact or comparable locations in previous years; and 2) the lack of participants present in public spaces during the lockdown, hence the inability to collect soundscape data in situ. Munoz et al. (2020) combined noise measurements with an online questionnaire deployed to residents, some of which were residing in the areas covered by the noise monitoring network available. The participants were asked to recall how their lockdown area sounded before and during the first lockdown in 2020 and to describe the perceived change. They observed a consistent reduction in levels, followed by the perceived reduction of transport sounds (air and road) and an increase of natural sounds, while the resulting environment was described as pleasant, calm, and peaceful. By combining field recordings and focus groups, Sakagami (2020) and Lenzi, Sádaba, and Lindborg (2021) observed changes in the sound source composition and the affective quality of soundscape in a residential area in Kobe, Japan and a public space in Getxa, Spain, respectively, during the different stages of the lockdown period. Following the easing of lockdown measures, a decrease in animal and traffic sounds was observed in Kobe, while an increase in eventfulness, loudness, and presence of human sound sources, followed by a decrease in pleasantness, was shown in Getxa.
Aletta et al. (2020) explored the impacts of the COVID-19 lockdowns on the acoustic environment in London in particular, through many short-term (30s) binaural recordings. This study revealed that average reductions in the various locations considered ranged from 10.7 dB (L_{Aeq}) to 1.2 dB, with an overall average reduction of 5.4 dB. This metric-reporting focused approach left the following research questions unanswered: how would people have perceived these spaces as a result of this change in acoustic environment (RQ1), and would these sound level reductions result in improvements to the soundscape of the spaces (RQ2)? The 1st research question (RQ1), addressing the perceptual effect of the change in urban soundscape induced by the lockdowns, can be further broken down into the following questions: how was the sound source composition influenced by the change; how would the affective response to the acoustic environment in lockdowns change; and could this demonstrate the effect of human activities on the perception of an acoustic environment in general?
These questions arise out of the soundscape approach, which is characterized by prioritizing the perceptual effect of an acoustic environment by taking into account the interaction of sound sources, context, and the person perceiving it (ISO 12913-1:2014 2014; Truax 1999), bringing together objective and subjective factors. The soundscape approach to noise mitigation and management is being recognized as a response to arising environmental requirements on noise pollution and sustainability, such as the regulation of quiet areas in Europe (European Union 2002; Kang and Aletta 2018; Radicchi et al. 2021). This has been further formalized in ISO/TS 12913-2:2018 (2018) via the adoption of the circumplex model of soundscape (Axelsson, Nilsson, and Berglund 2010), in which the perception of a soundscape can be described in terms of its pleasantness and eventfulness, as one of the standard methods of soundscape assessment.
Soundscape research is therefore traditionally rooted in environmental acoustics and environmental psychology, typically dealing with outdoor spaces (Torresin et al. 2020) and urban open spaces, where parks and squares are often used as case study sites (Kang 2006). A soundscape assessment typically requires people to be surveyed but the presence of people at a location influences assessment (Aletta and Kang 2018) and ‘quiet places’ usually require low numbers of users to remain quiet, which limits the possibility of an assessment. Even in a crowded public space, soundscape surveys are demanding as they require significant resources to carry out at scale, limiting their widespread application (Mitchell et al. 2020). Therefore, a need for a predictive model arises to overcome this limitation and improve the implementation of the soundscape approach into everyday planning and management practices.
According to a recent review of predictive soundscape models from Lionello, Aletta, and Kang (2020), the degree of employing auditory and non-auditory factors in soundscape prediction varies with some studies relying on contextual, personal/demographic (Erfanian et al. 2021; Tarlao, Steffens, and Guastavino 2020) or social media (Aiello et al. 2016) data entirely to predict and generate soundscape features. Some methods also incorporate perceptually-derived features, such as subjective sound level and visual pleasantness as predictors (Lionello, Aletta, and Kang 2020). In general, these methods which incorporate perceptually-derived inputs achieve better accuracy rates than those which don’t, however this perception information must also be obtained from people via a survey and therefore are unsuitable for predictive modeling where surveys are not possible. For example, Ricciardi et al. (2015) proposed two models based on data collected from a smartphone application to predict urban sound quality indicators based on linear regressions. The first model which incorporated perceptually-derived input features (visual quality and familiarity) achieved an R^2 of 0.72, while a second model without these features achieved an R^2 of 0.58. This indicates the necessity for considering and accounting for the influence which contextual factors in a space have on the relationship between the sound environment itself and the listener’s perception of it (i.e. the soundscape) while also highlighting the challenges associated with a predictive model which depends only on measurable features.
Therefore, a third research question arises: what are the key features needed for a soundscape prediction model based on comprehensive acoustic on-site measurements to be used for assessing locations with low social presence or in situations where conducting surveys is impractical (RQ3)?
2 Materials and methods
This study was conducted via initial onsite data collection campaigns in Central London and Venice in 2019 before the outbreak of COVID-19 as part of the Soundscape Indices (SSID) project (Mitchell et al. 2020) and in 2020 during the strictest part of the lockdowns (Aletta et al. 2020), including objective acoustic data (2019 and 2020) and subjective responses (2019 only). The full in situ dataset, as described in this section, has been made publicly available as ‘The International Soundscape Database (V0.2.1)’ on Zenodo1(Mitchell et al. 2021).
Using both 2019 and 2020 binaural recordings, an online listening experiment was conducted to provide an understanding about the change in sound source composition. The 2019 onsite questionnaire data were used to define the dominant sound source at each location as a starting point for interpreting soundscape change. A predictive model was developed to reveal the change in the perceived pleasantness and eventfulness using objective acoustic data and location to predict subjective responses. Although the initial (2019) dataset contains additional locations (specifically, in Spain, the Netherlands, and China), due to the nature of this study as a reaction to the strict movement and activity restrictions, the sites which could be included in the lockdown (2020) measurement campaigns were limited to locations where staff and equipment had access and where recordings could be undertaken during the spring of 2020.
The sites were selected to provide a mixture of sizes and uses, varying in typology ranging from paved squares to small and large parks to waterside spaces across both cities. Throughout the text they are indexed via a LocationID based on the location’s name (e.g. CamdenTown, SanMarco), while a more in-depth overview of each is given in supplementary material2. London is taken as an example of a large, typically noisy city while the Venice sample provides a unique look at spaces with typically very high human activity levels and no road traffic activity. In particular, the 2019 Venice surveys were taken to coincide with the yearly Carnevale festival in order to capture its distinct soundscape.
The ISO/TS 12913 (ISO/TS 12913-2:2018 2018) series were consulted for reporting on soundscape data. A detailed description of the 2019 survey campaigns is featured throughout the paper and in the public database. This study was approved by departmental UCL IEDE Ethics Committee on 17th July 2018 for onsite data collection and on the 2nd of June 2020 for the on-line listening experiment and is conducted in adherence to the ethical requirements of the Declaration of Helsinki (World Medical Association 2013).
2.1 Onsite data: Questionnaires, binaural measurements, and recordings
The initial onsite data collection featured both questionnaire data collected from the general public and acoustic measurements, conducted across thirteen urban locations (in London N=11, in Venice N=2) between the 28th of February and the 21st of June 2019, with additional sessions in July and October 2019. Although the total survey period in 2019 extended over several seasons, the surveys at any individual location did not extend over seasons with different occupancy patterns. A total of 1,318 questionnaire responses were collected from the general population across the measurement points during 1 – 3 hour-long campaigns in both cities in 2019, accompanied by 693 approximately 30-second long 24-bit 44.1 kHz binaural recordings. After data cleaning, each of the 13 locations was characterized by between 14 to 80 recordings and between 24 to 147 questionnaire responses. Mean age of the participants was 33.8, with a standard deviation of 14.57 (45% male, 53.8% female, 0.4% non-conforming, 0.9% prefer-not-to-say).
Although recent results from both Tarlao, Steffens, and Guastavino (2020) and Erfanian et al. (2021) indicate the important influence of personal and demographic factors – in particular age and gender – on soundscape perception, these factors were not included as potential features in the modeling process. Given the nature of this study as addressing a scenario when people could not be surveyed, no additional demographic information is available in the lockdown case to be fed into the model and is therefore not useful to include for the development and application of this specific predictive model. This information is reported throughout the study simply to provide further context to the data collection.
The subsequent measurement campaign in 2020 mimicked the binaural recording strategy applied in the initial campaign and was performed between the 6th and the 25th of April 2020 in both cities, this time excluding the questionnaire. An additional 571 binaural recordings were collected on-site in 2020.
2.1.1 Data collection
The 2019 data collection was performed across all the locations using the protocol based on the Method A of the ISO/TS 12913-2:2018 (2018), as described in Aletta et al. (2020) and Mitchell et al. (2020), collected either via handheld tablets or paper copies of the questionnaire. The full questionnaire and data collection procedure are given in Mitchell et al. (2020), however the key parts used for this study are those addressing sound source dominance and perceived affective quality (PAQ).
Participants are first asked to rate the perceived dominance of several sound sources, as assessed via a 5-point Likert scale, coded from 1 (Not at all) to 5 (Dominates completely). The sound sources are split into four categories: Traffic noise, Other noise, Human sounds, and Natural sounds and each is rated separately. Next are the 8 PAQs which make up the circumplex model of soundscape (Axelsson, Nilsson, and Berglund 2010): pleasant, chaotic, vibrant, uneventful, calm, annoying, eventful, and monotonous. These are assessed on a 5-point Likert scale from 1 (Strongly disagree) to 5 (Strongly agree). In order to simplify the results and allow for modeling the responses as continuous values, the 8 PAQs undergo a trigonometric projection to reduce them onto the two primary dimensions of pleasant and eventful, according to the procedure outlined in Part 3 of the ISO 12913 series (ISO/TS 12913-3:2019 2019). In order to distinguish the projected values from the Likert-scale PAQ responses, the projected values will be referred to as ISOPleasant and ISOEventful and can be considered to form an x-y coordinate point (x = ISOPleasant, y = ISOEventful) as explained in detail in Lionello et al. (2021).
The calibrated binaural device SQobold with BHS II by Head Acoustics was used in both campaigns at all the locations by various operators to capture acoustic data, as mentioned in the acknowledgments. Following the established onsite protocol (Mitchell et al. 2020), when participants were stopped in a group and filled in their responses simultaneously, a single binaural recording was used to capture their experience as a group. The purpose behind this sampling strategy was to obtain data from the perspective of a typical user, corresponding to a range of individual experiences available within an urban open space. These recordings are indexed by a GroupID such that the recording for each group is matched up to each of the corresponding respondents and their individual survey responses.
2.1.2 Data cleaning
The cleaning of the samples was conducted using the ArtemiS SUITE 11. The researcher discarded or cropped whole recordings, or its parts affected by wind gusts or containing noises and speech generated by the recording operator by accident or for the purpose of explaining the questionnaire to a participant. This resulted in 1,258 binaural recordings then processed further, as described in Section 2.1.3. Psychoacoustic analyses are shown in the publicly available database3.
In order to maintain data quality and exclude cases where respondents either clearly did not understand the PAQ adjectives or intentionally misrepresented their answers, surveys for which the same response was given for every PAQ (e.g. ‘Strongly agree’ to all 8 attributes) were excluded prior to calculating the ISO projected values. This is justified as no reasonable respondent who understood the questions would answer that they ‘strongly agree’ that a soundscape is pleasant and annoying, calm and chaotic, etc. Cases where respondents answered ‘Neutral’ to all PAQs are not excluded in this way, as a neutral response to all attributes is not necessarily contradictory. In addition, surveys were discarded as incomplete if more than 50% of the PAQ and sound source questions were not completed.
The site characterization per ISO/TS 12913-2:2018 (2018) is available in the supplementary material4 and public database5, featuring the address, overall psychoacoustic characteristics of the location, typical use of each location, and pictures taken during the survey sessions.
2.1.3 Psychoacoustic analyses
The binaural recordings were analyzed in ArtemiS SUITE 11 to calculate the suite of 11 acoustic and psychoacoustic features given in Table 1 to be used as initial predictors. The (psycho)acoustic predictors investigated were selected in order to describe many aspects of the recorded sound – in particular, the goal was to move beyond a focus on sound level, which currently dominates the existing literature on the acoustic effects of lockdowns noted in Section 1. In all, they are expected to reflect the sound level (L_{Aeq}), perceived sound level (Loudness), spectral content (Sharpness, L_{Ceq}-L_{Aeq}, Tonality), temporal character or predictability (Impulsiveness, Fluctuation Strength, Relative Approach), and overall annoyance (Psychoacoustic Annoyance). These metrics have been proposed as indicators to predict perceptual constructs of the soundscape (Aletta, Kang, and Axelsson 2016; Aletta, Axelsson, and Kang 2017) and have shown promise when combined together to form a more comprehensive model applied to real-world sounds (Orga et al. 2021). The maximum value from the left and right channels of the binaural recording are used, as suggested in ISO/TS 12913-3:2019 (2019).
| Feature | Symbol | Unit | Calculation Method |
|---|---|---|---|
| Loudness (5th percentile) | N_5 | sones | ISO 532-1:2017 (2017) |
| Sharpness | S | acum | ISO 532-1:2017 (2017) |
| Roughness | R | asper | Sottek and Genuit (2005) |
| Impulsiveness | I | iu | Sottek and Genuit (2005) |
| Fluctuation Strength | FS | vacil | Sottek and Genuit (2005) |
| Tonality | T | tuHMS | Sottek and Genuit (2005) |
| Psychoacoustic Annoyance | PA | – | Zwicker and Fastl (2007) |
| L_{Aeq} | L_{Aeq} | dB | IEC 61672-1:2013 (2013) |
| L_{A10}-L_{A90} | L_{A10}-L_{A90} | dB | ISO 1996-1:2016 (2016) |
| L_{Ceq}-L_{Aeq} | L_{Ceq}-L_{Aeq} | dB | ISO 1996-1:2016 (2016) |
| Relative Approach | RA | cPA | Sottek and Genuit (2005) |
Table 2 shows the Pearson correlation coefficient between each of the candidate acoustic features and the outcome pleasantness and eventfulness. As all variables considered are continuous, and the eventual model is linear, the Pearson coefficient is chosen as a measure of the strength of the linear relationship between two continuous variables. For ISOPleasant (ISOPl), we can perhaps see three tiers of correlations: the more highly correlated tier (|r| > 0.28) consists of Relative Approach (RA), L_{Aeq}, Roughness (R), Loudness (N_5), and Psychoacoustic Annoyance (PA); the low correlation tier consists of L_{A10}-L_{A90}, Tonality (T), and Fluctuation Strength (FS); while L_{Ceq}-L_{Aeq}, Impulsiveness (I), and Sharpness (S) show no correlation. For ISOEventful (ISOEv), these tiers are: RA, L_{Aeq}, T, R, and N_5 comprise the most correlated tier (|r| > 0.30); L_{Ceq}-L_{Aeq}, L_{A10}-L_{A90}, FS, and PA show low correlations; I and S show no correlation.
| Parameter | ISOPl | ISOEv | PA | N_5 | S | R | I | FS | T | L_{Aeq} | L_{A10}-L_{A90} | L_{Ceq}-L_{Aeq} |
|---|---|---|---|---|---|---|---|---|---|---|---|---|
| ISOPleasant | ||||||||||||
| ISOEventful | -0.24 | |||||||||||
| PA | -0.28 | 0.24 | ||||||||||
| N_5 | -0.37 | 0.33 | 0.94 | |||||||||
| S | 0.71 | 0.56 | ||||||||||
| R | -0.36 | 0.32 | 0.63 | 0.74 | 0.11 | |||||||
| I | -0.10 | -0.37 | 0.24 | |||||||||
| FS | -0.11 | 0.14 | 0.37 | 0.43 | 0.46 | 0.55 | ||||||
| T | -0.21 | 0.30 | 0.58 | 0.63 | 0.12 | 0.54 | 0.16 | 0.52 | ||||
| L_{Aeq} | -0.34 | 0.37 | 0.84 | 0.93 | 0.56 | 0.72 | -0.09 | 0.37 | 0.57 | |||
| L_{A10}-L_{A90} | -0.18 | 0.15 | 0.21 | 0.33 | -0.20 | 0.31 | 0.36 | 0.44 | 0.40 | 0.23 | ||
| L_{Ceq}-L_{Aeq} | -0.20 | -0.49 | -0.49 | -0.54 | -0.31 | -0.27 | -0.28 | -0.61 | -0.22 | |||
| RA | -0.34 | 0.31 | 0.60 | 0.74 | 0.18 | 0.71 | 0.31 | 0.63 | 0.58 | 0.73 | 0.23 | -0.14 |
Among the inter-correlations for the psychoacoustic metrics considered for inclusion as input features, we can see several very highly correlated features (i.e. >0.9). As expected, PA, L_{Aeq}, and N_5 are highly correlated, meaning that careful consideration is paid to these features to ensure they do not contribute to multicollinearity in the final model.
2.2 Modelling
Two linear multi-level models (MLM) were computed to predict: 1) ISOPleasant, and 2) ISOEventful. These models are trained on the 2019 data only, then applied to the acoustic data collected during the 2020 lockdowns, the results of which are reported in Section 3.2.3. The inherent grouped structure of the SSID database necessitates a modeling and analysis approach which considers the differing relationships between the objective acoustic features and the soundscape’s perceived affective quality ratings across the various locations and contexts. The individual-level of the models is made up of the acoustic features calculated from the binaural recordings made during each respondent’s survey period, while the group-level includes the categorical LocationID variable indicating the location in which the survey was taken, acting as a non-auditory contextual factor.
A separate backwards-step feature selection was performed for each of the outcome models in order to identify the minimal feature set to be used for predicting each outcome. In this feature selection process, an initial model containing all of the candidate features was fit. Each feature was then removed from the model one at a time, then the best-performing model is selected and the procedure continues step-wise until no improvement is seen by removing more features. This process is carried out first on the location-level features (including the potential to remove all features including LocationID, resulting in a ‘flat’ or standard multivariate linear regression model), then on the individual-level features. The performance criterion used for this process was the Akaike Information Criterion (AIC) (Akaike 1974). To check for multicollinearity among the selected features, the variance inflation factor (VIF) was calculated and a threshold of VIF <5 was set. Any features which remained after the backwards stepwise selection and which exceeded this threshold were investigated and removed if they were highly collinear with the other features.
All of the input features are numeric values, in the units described above. Before conducting feature selection, the input features are z-scaled to enable proper comparison of their effect sizes. After the feature selection, the scaled coefficients are used in the text when reporting the final fitted models to facilitate discussion and comparison between the features. The unscaled model coefficients are reported in ?@sec-appmod to enable the models to be applied to new data. In order to properly assess the predictive performance of the model, an 80/20 train-test split with a balanced shuffle across LocationIDs was used. The z-scaling and feature selection was performed on the training set only, in order to prevent data leakage. To score the performance of the model on the training and testing sets, we use the mean absolute error (MAE), which is in the scale of the response feature - for ISOPleasant this means our response can range from -1 to +1. However, since the end-goal of the model is to predict the soundscape assessment of the location as a whole, rather than the individual responses, we also assess the performance of the model in predicting the average response in each location. To do this, the mean response value for each location is calculated, and the R^2 accuracy across LocationIDs is reported for both the training and testing sets.
The model fitting and feature selection was performed using the step function from lmerTest (v3.1.3) (Kuznetsova, Brockhoff, and Christensen 2017) in R statistical software (v4.0.3) (R Core Team 2018). The summaries and plots were created using the sjPlot package (v2.8.6) (Lüdecke 2021) and seaborn (v0.11.1) (Waskom 2021).
2.3 Online survey
An online listening test was conducted using the Gorilla Experiment Builder6 (Anwyl-Irvine et al. 2019). The participants were exposed to a random selection of 78 binaural recordings (39 from 2019 and 39 from 2020, 6 recordings per each location). Each participant had the option to evaluate either 1 or 2 sets of 6 recordings randomly assigned between 13 stimuli sets. Mp3 files, converted at 256 kBps were used due to the requirements of the Gorilla platform.
No visual stimuli were used in the experiment. The experiment consisted of: 1) an initial exercise to enhance chances of participants complying to the instructions and wearing headphones; 2) a training set using two randomly chosen binaural recordings (then not used in the main task) from the dataset; 3) a soundscape characterization questionnaire starting with an open-ended question about perceived sound sources and featuring the same questions as the one used in situ, looking into the perceived affective quality of the soundscape and the perceived sound source dominance of the following four types: traffic noise, other noise, human sounds and natural sounds; 4) a questionnaire on the basic demographic factors. The questionnaire used in the Part 3 of the online experiment is reported in Appendix A.
Having in mind the remote nature of the study and to ensure a minimum level of robustness for reliable sound source recognition, an initial exercise was performed consisting of a headphone screening test (Woods et al. 2017) and a headphone reproduction level adjustment test (Gontier et al. 2019). The level adjustment was performed using an eleven-second-long pink noise sample matched to the lowest and the highest L_{A90} values from the experimental set. Participants were asked to adjust their listening level to clearly hear the quieter sample while keeping the level low enough, so they don’t find the louder sample disturbing. The headphones screening test followed, featuring a stereo signal of one-second-long 100 Hz sine tone, generated with Izotope RX 6 application, played at a 3 dB difference where one of the equally loud pairs had its phase inverted. A 100 Hz sine was used because the pilot tests revealed the 200 Hz sine tone proposed by Woods et al. (2017) created a higher uncertainty varying across different laptop models and would likely contribute to the chances of a participant fooling the test. It was expected that participants using speakers would not be able to either hear the sine wave or would be fooled by the inverted phase effect and therefore not able to pass the trials, unless they were indeed using headphones. The participant needed to recognize the quietest of the 3 samples in a trial of 6 attempts. Only participants correctly answering 5 or more out of 6 trials were allowed to proceed with the experiment. Participants were asked not to change their audio output settings during the rest of the experiment. (This was introduced to ensure that a participant is using a headphones playback system which allows a listener to clearly recognize a 3 dB difference at 100 Hz as a proxy for sufficient audio quality playback.)
However, after the initial data collection, questions were raised as to how the playback loudness impacts ecological validity as it relates to the perceived affective quality of the soundscape. Given this concern, the PAQ responses from the online surveys were not included in further data analysis. Sound source identification is not considered to suffer the same validity concerns as this is not directly dependent on absolute playback level and requires only that the participant can clearly hear what is present. The purpose of the calibration procedure described above was to ensure the participant could clearly hear the softest samples used.
Online questionnaire data was collected between the 9th of June and the 9th of August 2020. Within the Gorilla Experiment Builder, a total of 250 attempts to complete the experiment were recorded, where 165 participants were excluded either on the basis of not passing the headphones screening (N=79) or for not completing the experiment, usually before engaging into the screening (N=83). Out of a total of 88 participants who completed the test, 2 participants were excluded as outliers as they provided uniform answers across all the questions and commented on not being able to properly hear the stimuli, despite their successful completion of the training tests. The participants of the online experiment were of mean age 32.42, 45.1% male, 54.9% female.
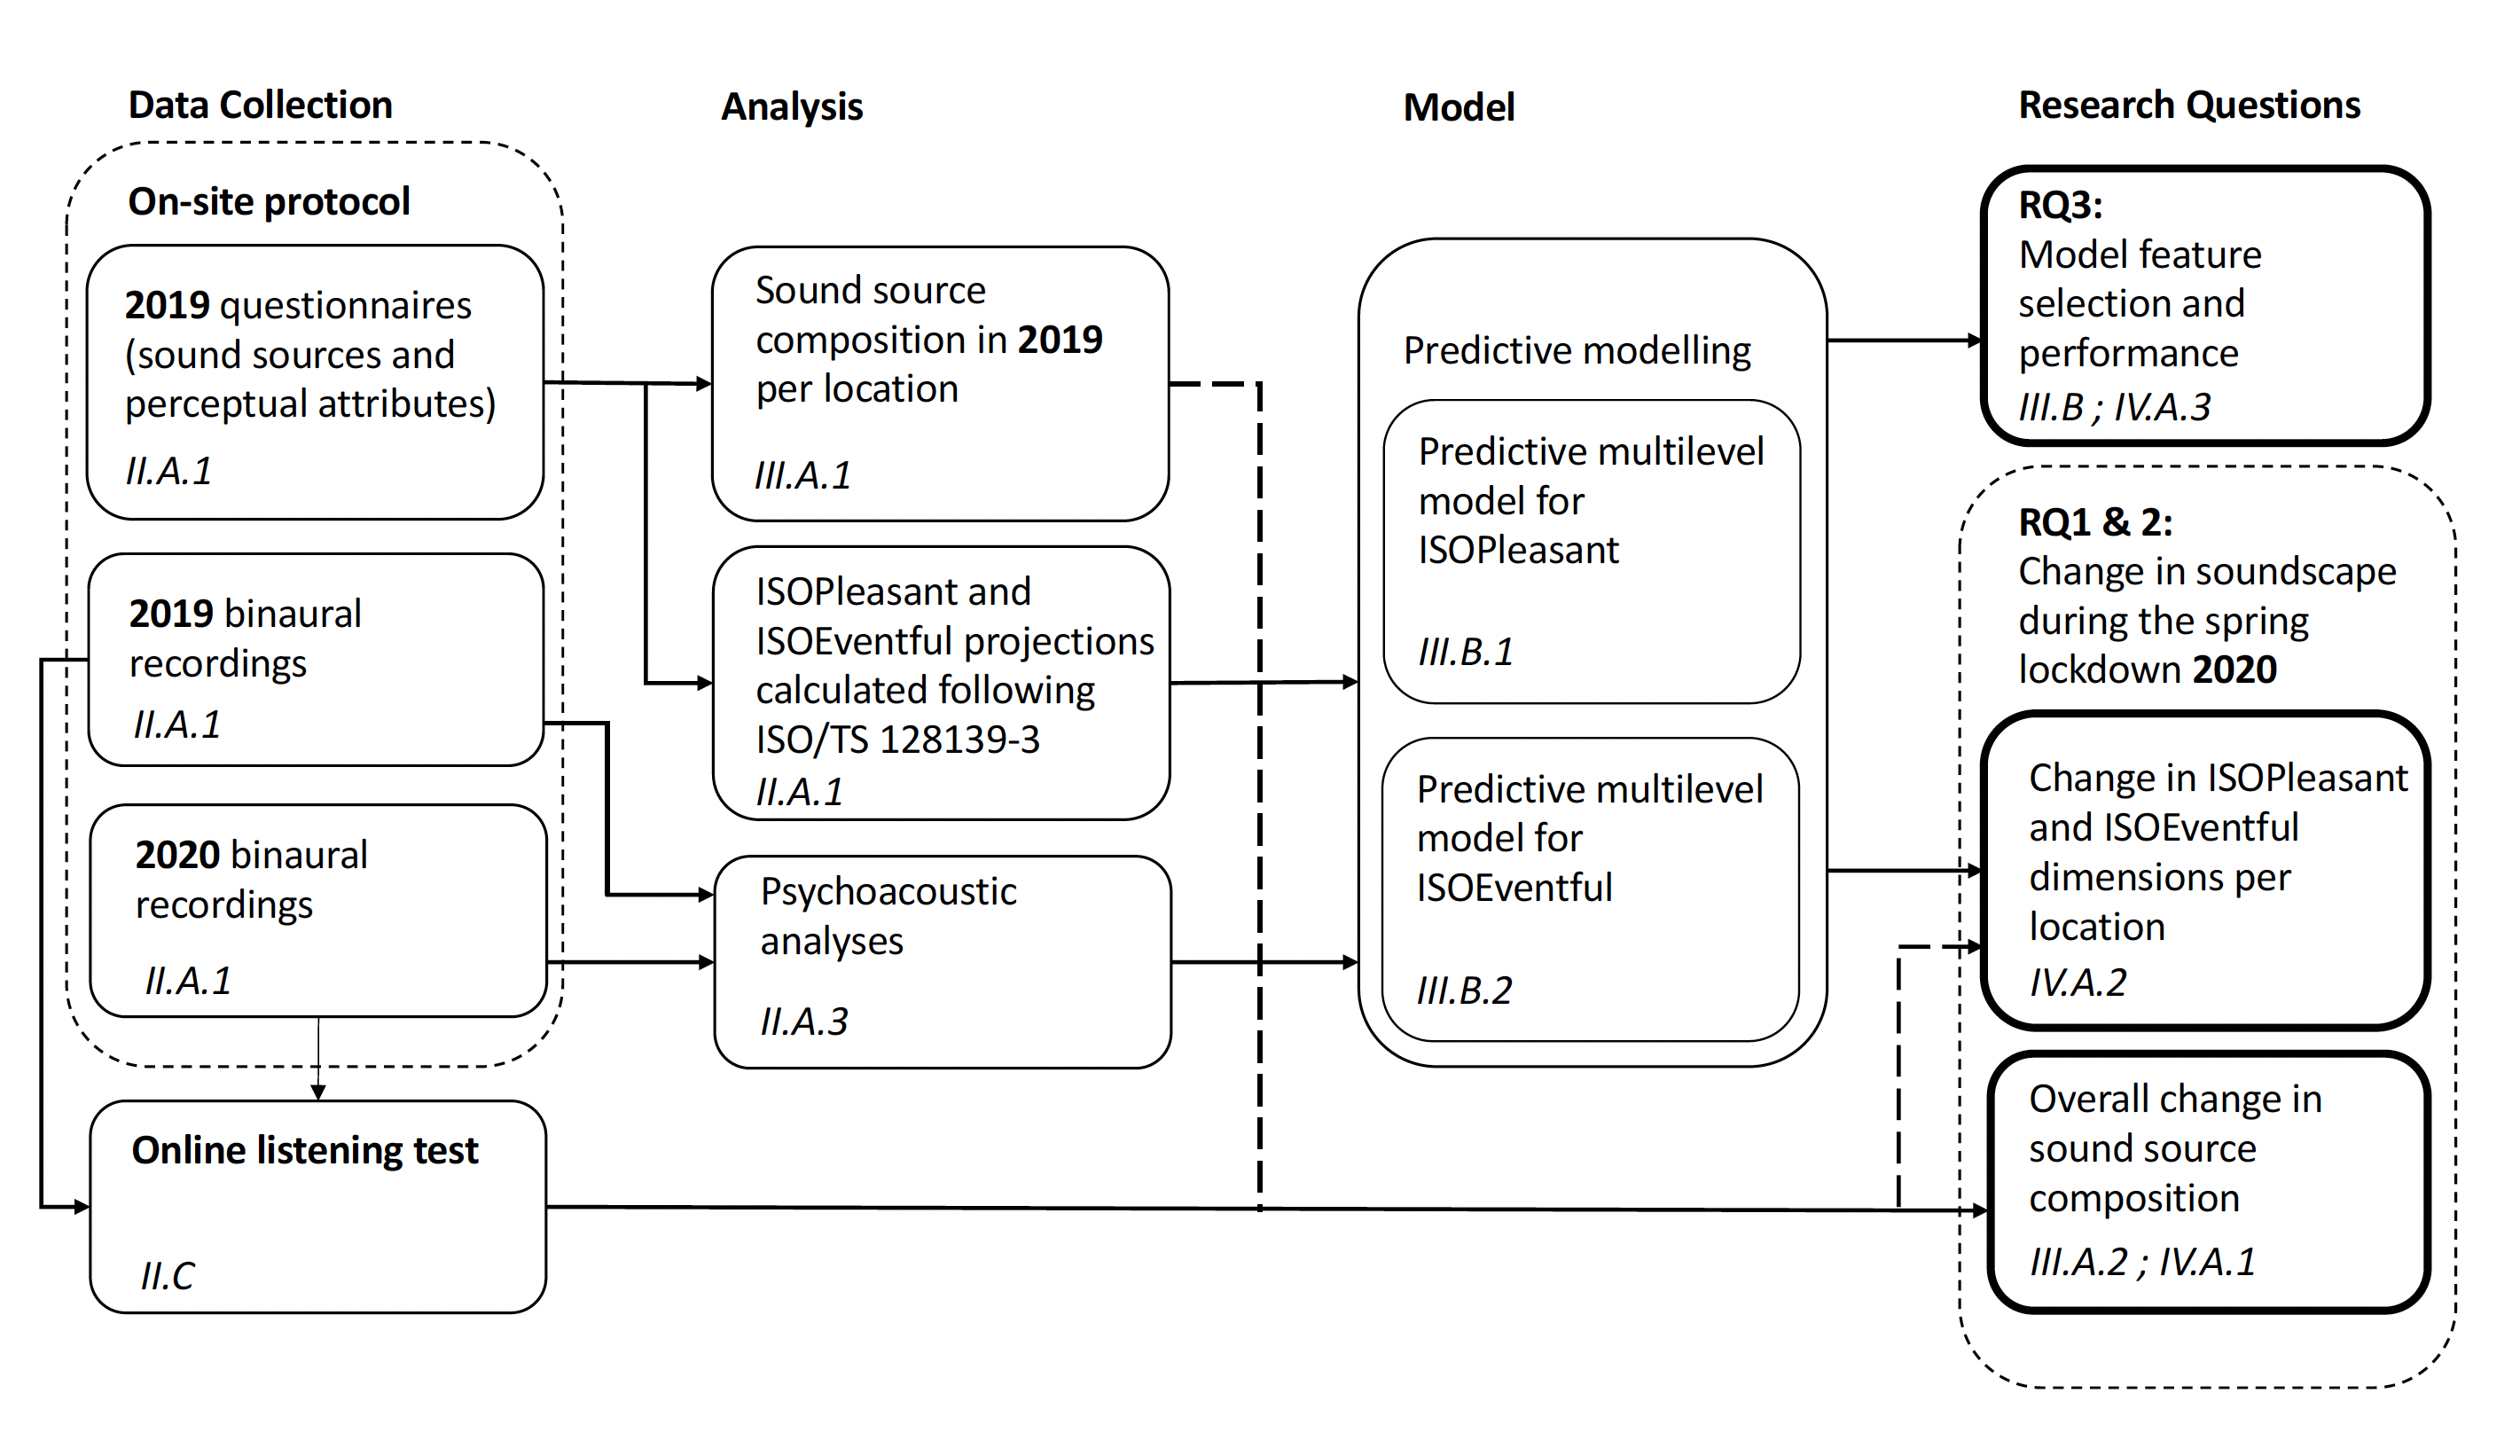
Figure 1 illustrates and summarizes the framework and sections described above.
3 Results
The results of the onsite surveys, online experiment, and the model development are reported here. They are reported following the structure of the ISO/TS 12913 series, revealing the perceived sound source dominance, key perceptual attributes (ISOPleasant and ISOEventful) and the lockdown-related changes.
3.1 Perceived sound source dominance
3.1.1 2019 sound source composition per location
Questionnaire data was collected in English, Italian, and Spanish in both cities. The respective questionnaires can be found in the supplementary files and Mitchell et al. (2020). Data presented here was aggregated per LocationID.
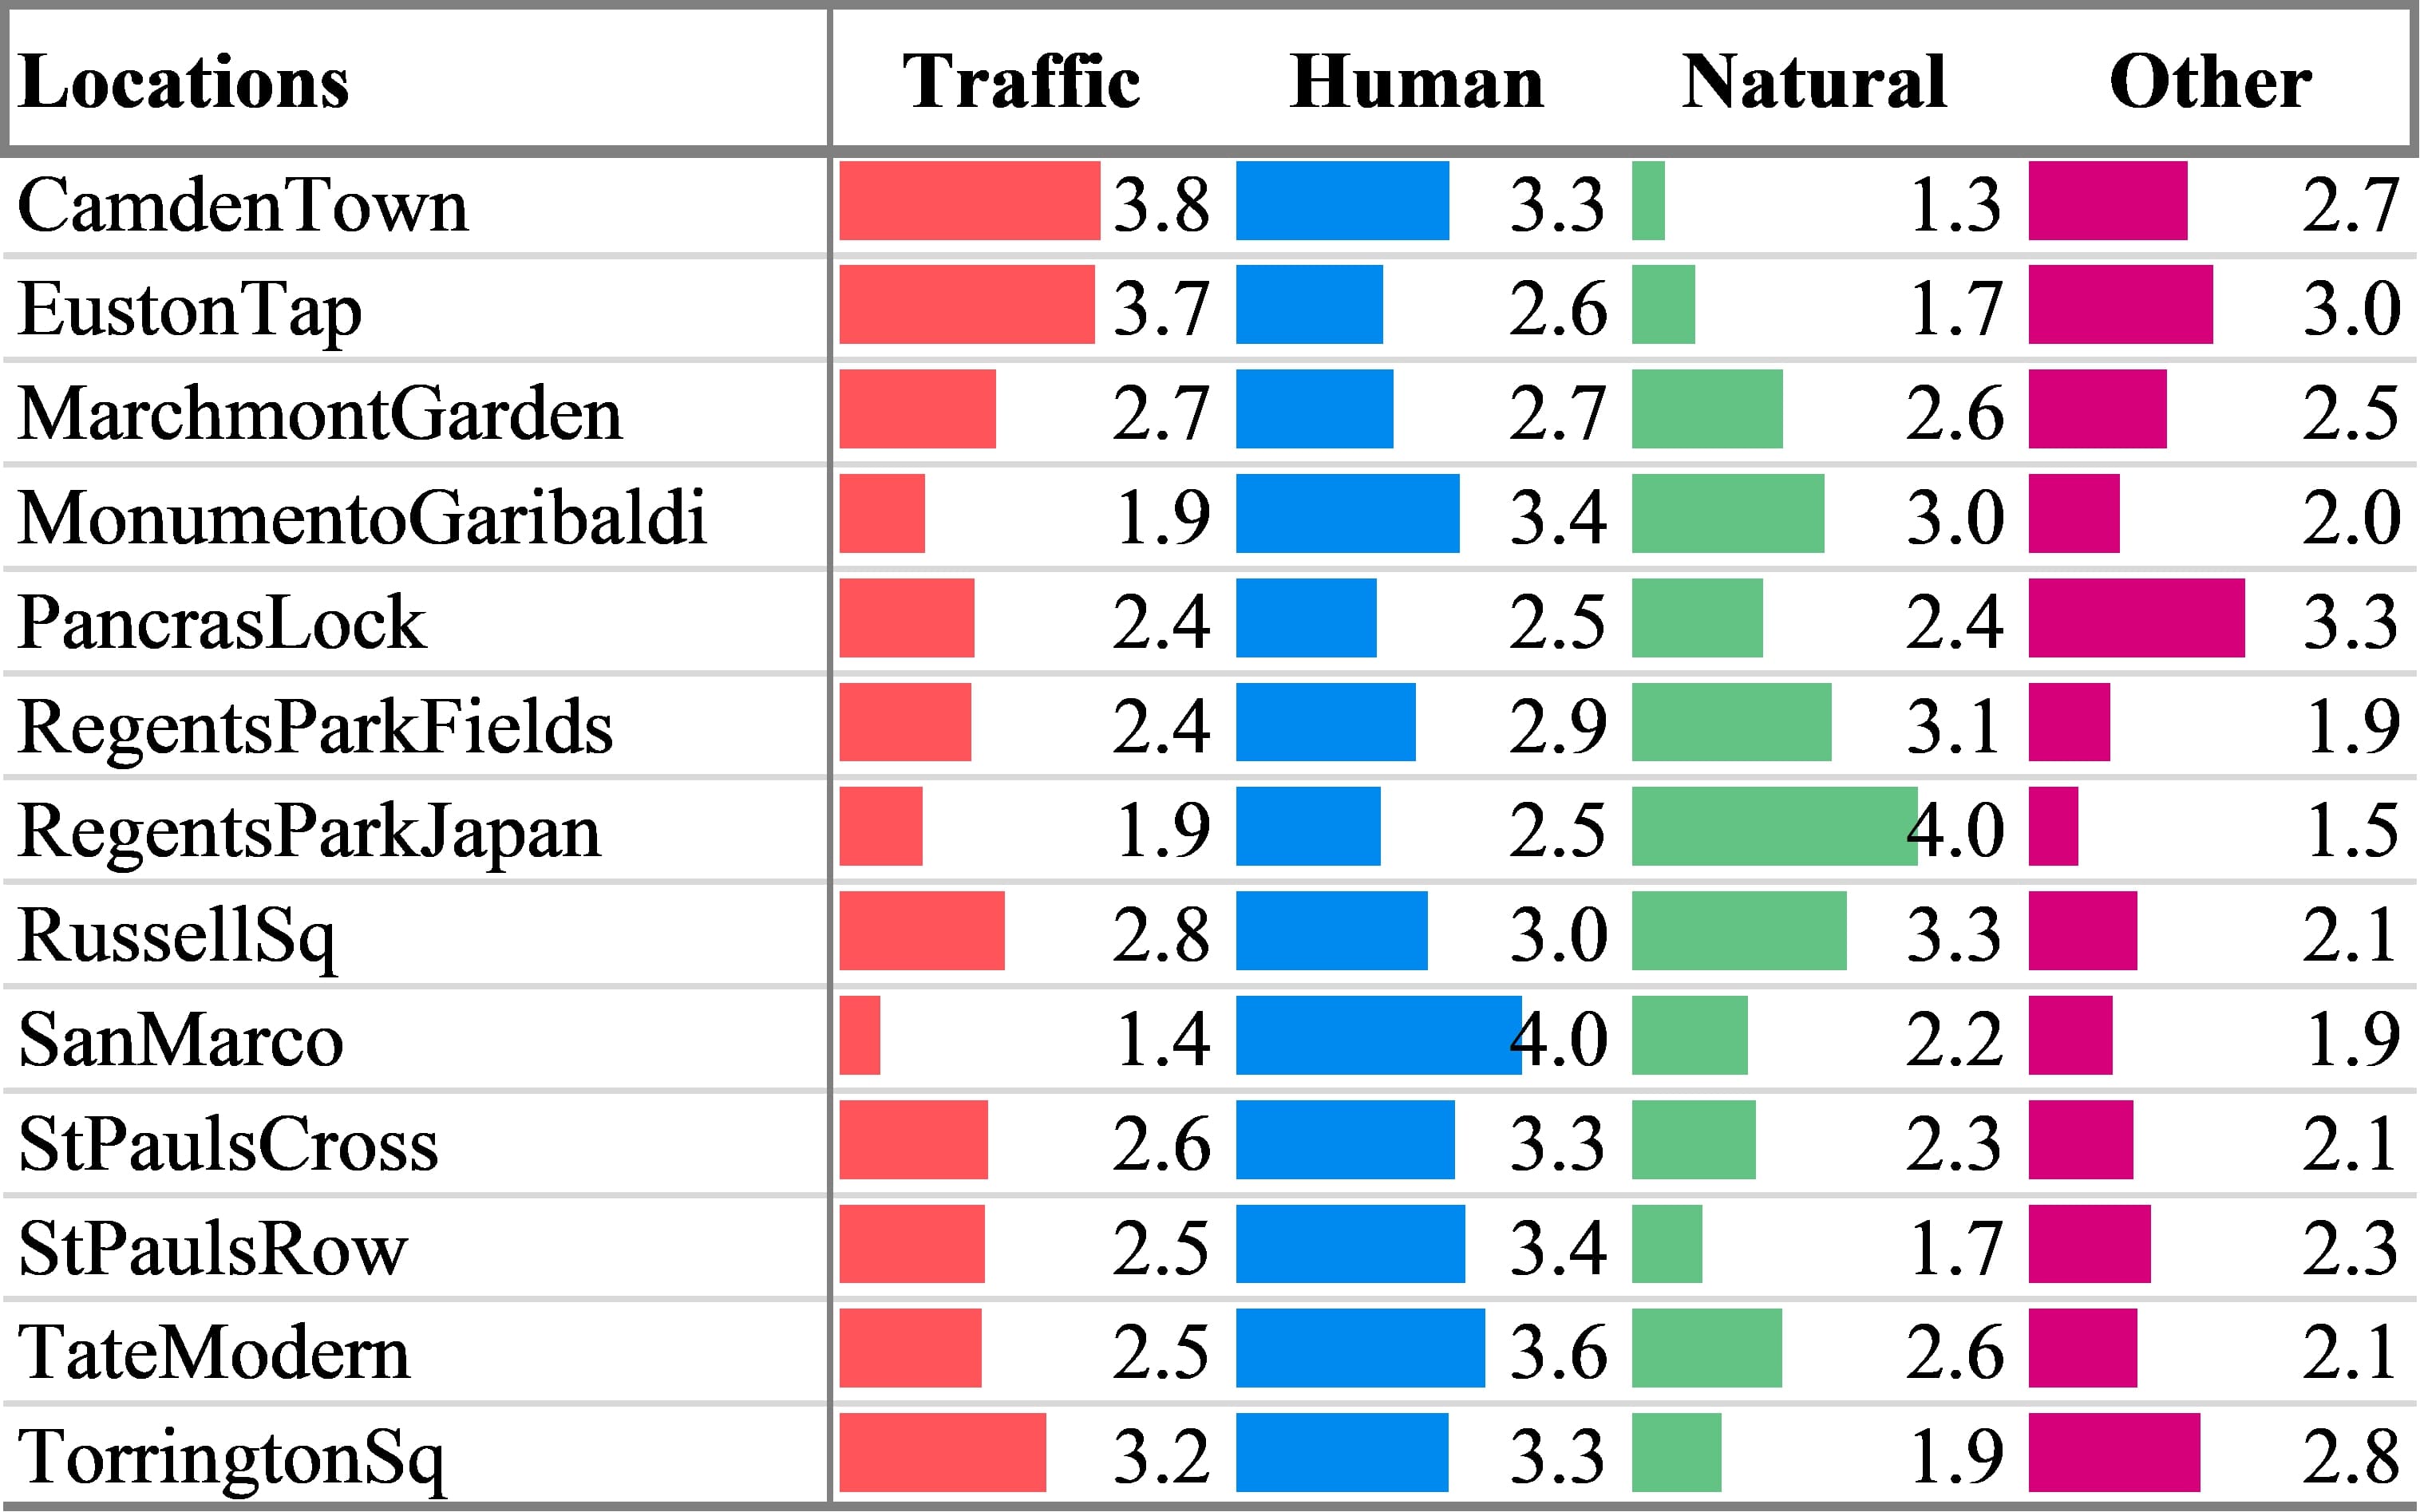
According to the highest scored mean value of the dominant sound source type, as shown in Figure 2, the locations can be grouped into: natural sounds dominated (RegentsParkJapan, RegentsParkFields, RussellSq), human sounds dominated (SanMarco, TateModern, StPaulsRow, StPaulsCross, MonumentoGaribaldi), noise (traffic and other noise) sounds dominated (CamdenTown, EustonTap, TorringtonSq, PancrasLock). Traffic noise and Other noise have been combined here, and for the rest of the discussion, as these responses are highly correlated within this dataset and it is not helpful to consider them separately for this analysis. This follows the alternative sound source labels given in Figure C.3 of ISO/TS 12913-2:2018 (2018) which combines Traffic and Other Noise. Finally, MarchmontGarden is unique in that all sound source types are assessed as being nearly equally present, with only 0.2 separating the least present (Other noise, 2.5) and the most present (Traffic noise, 2.7).
3.1.2 Overall change in the perceived sound source dominance during lockdown
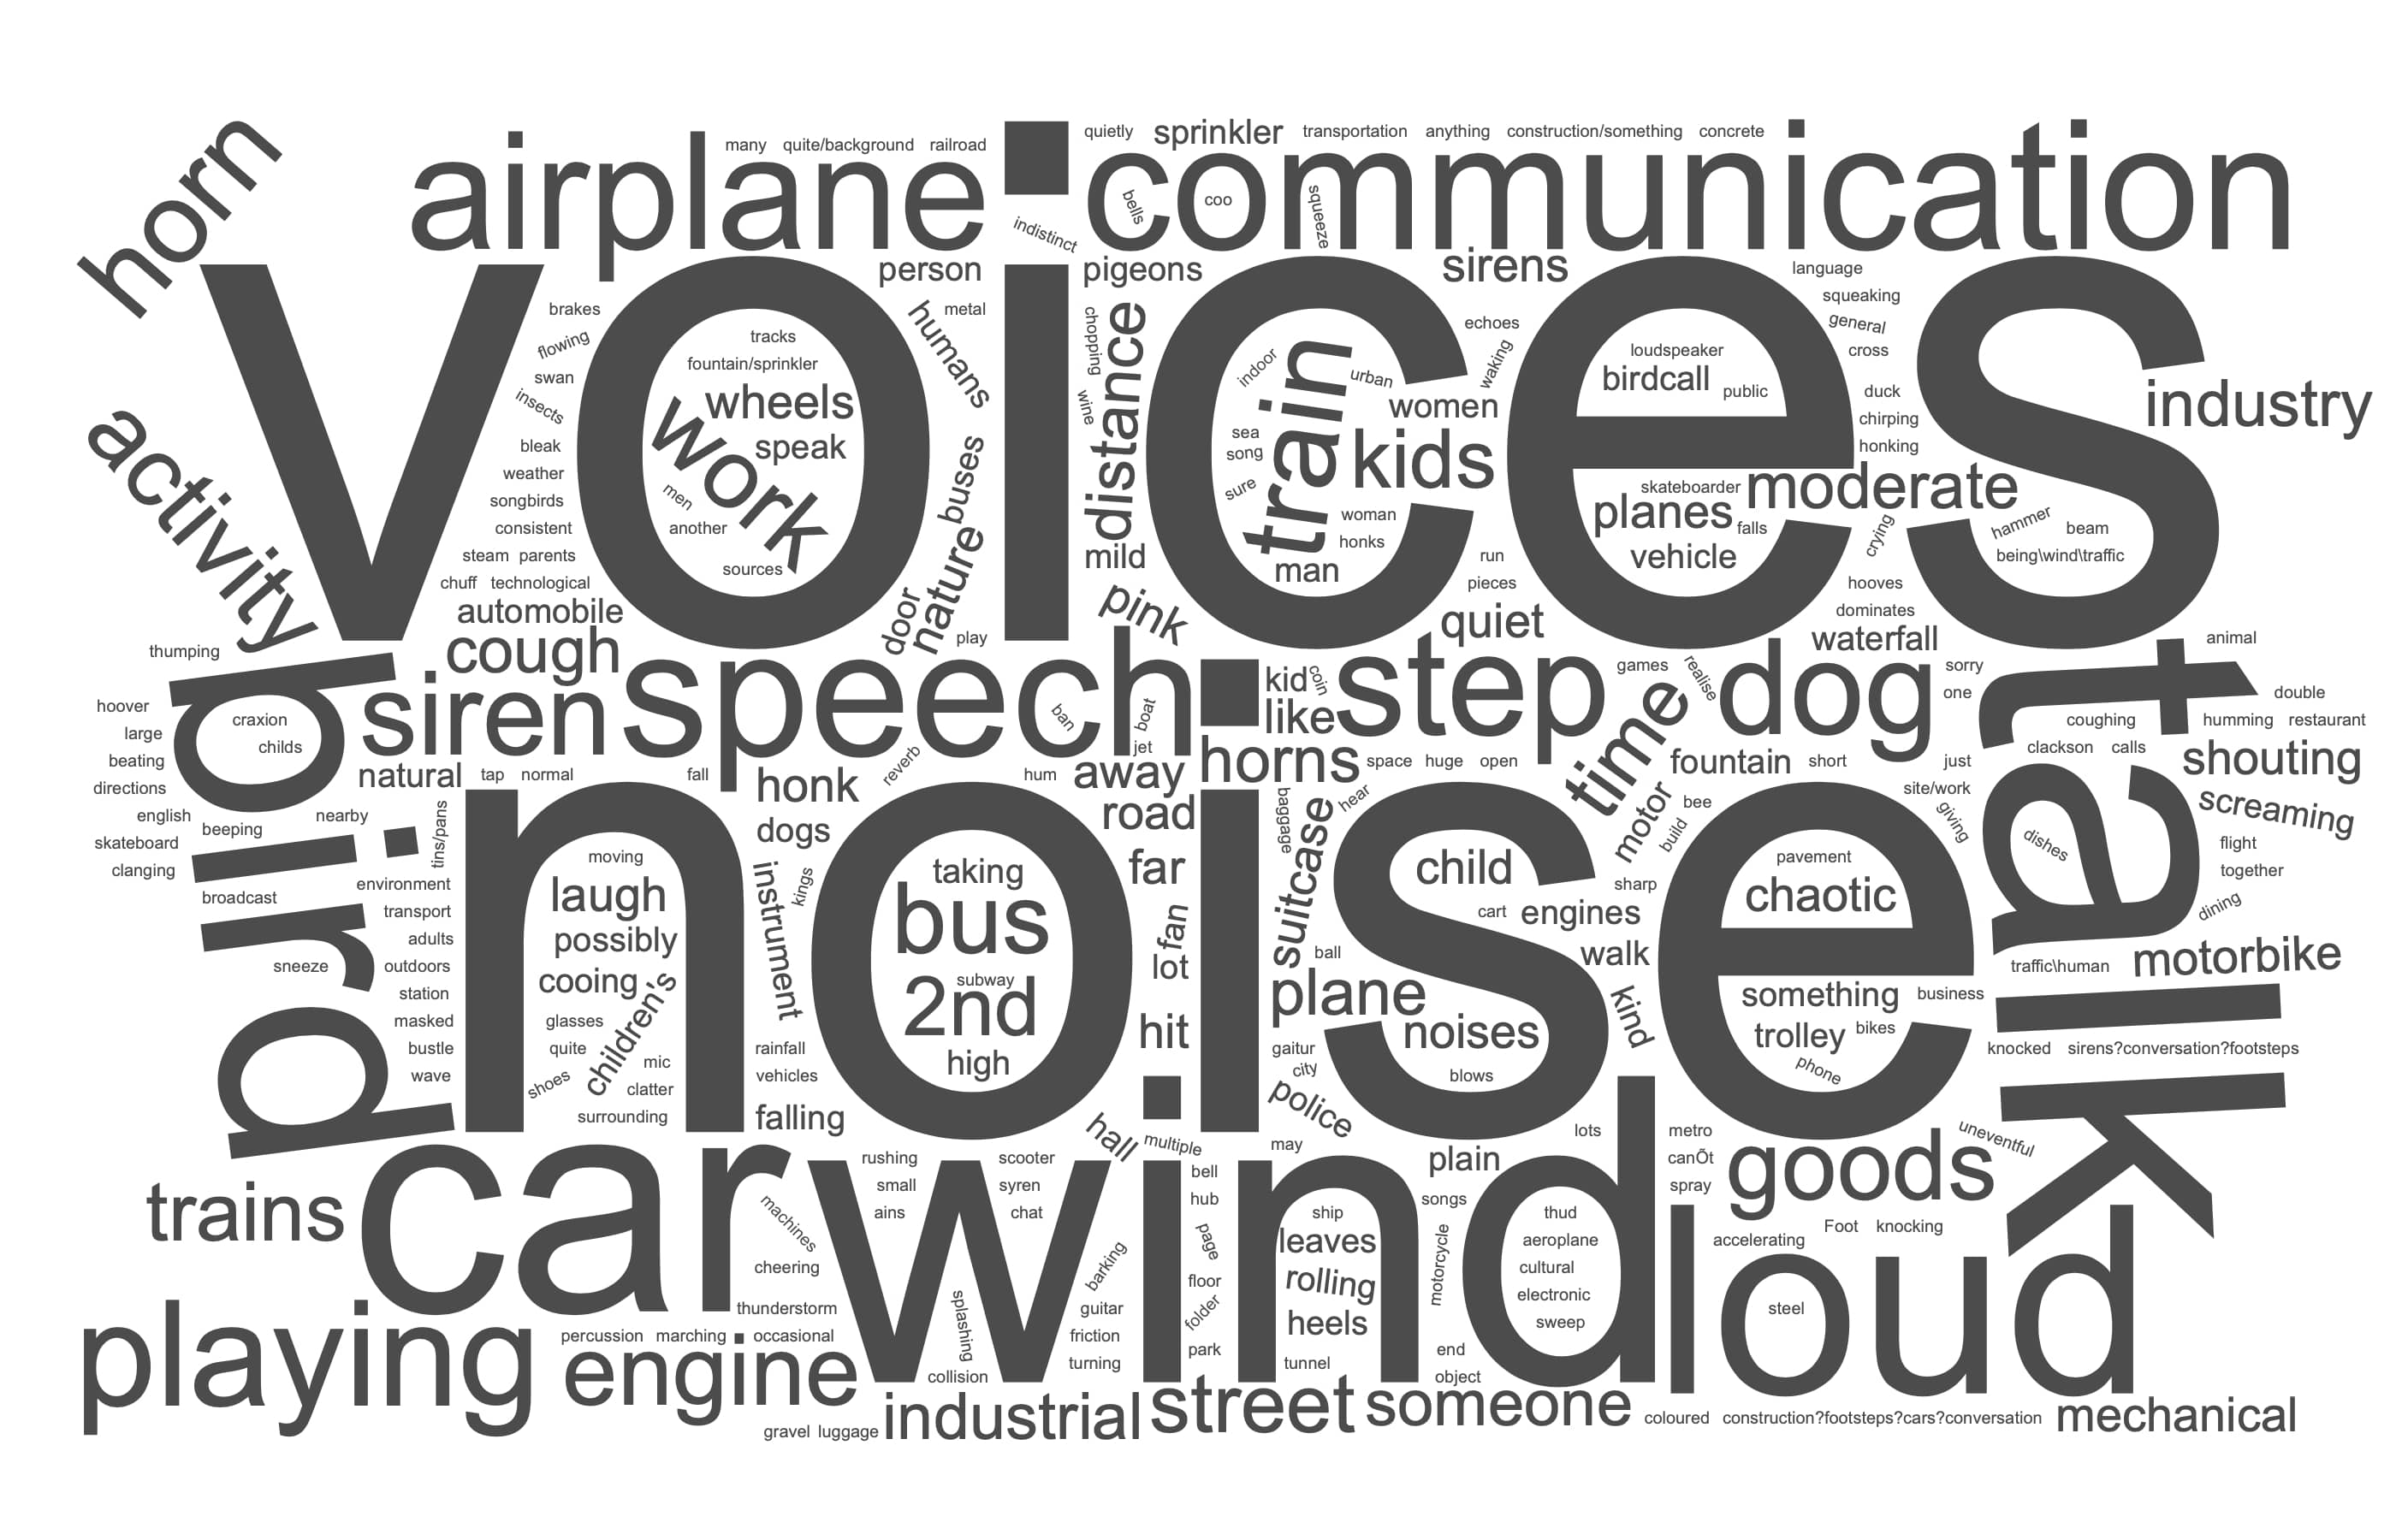
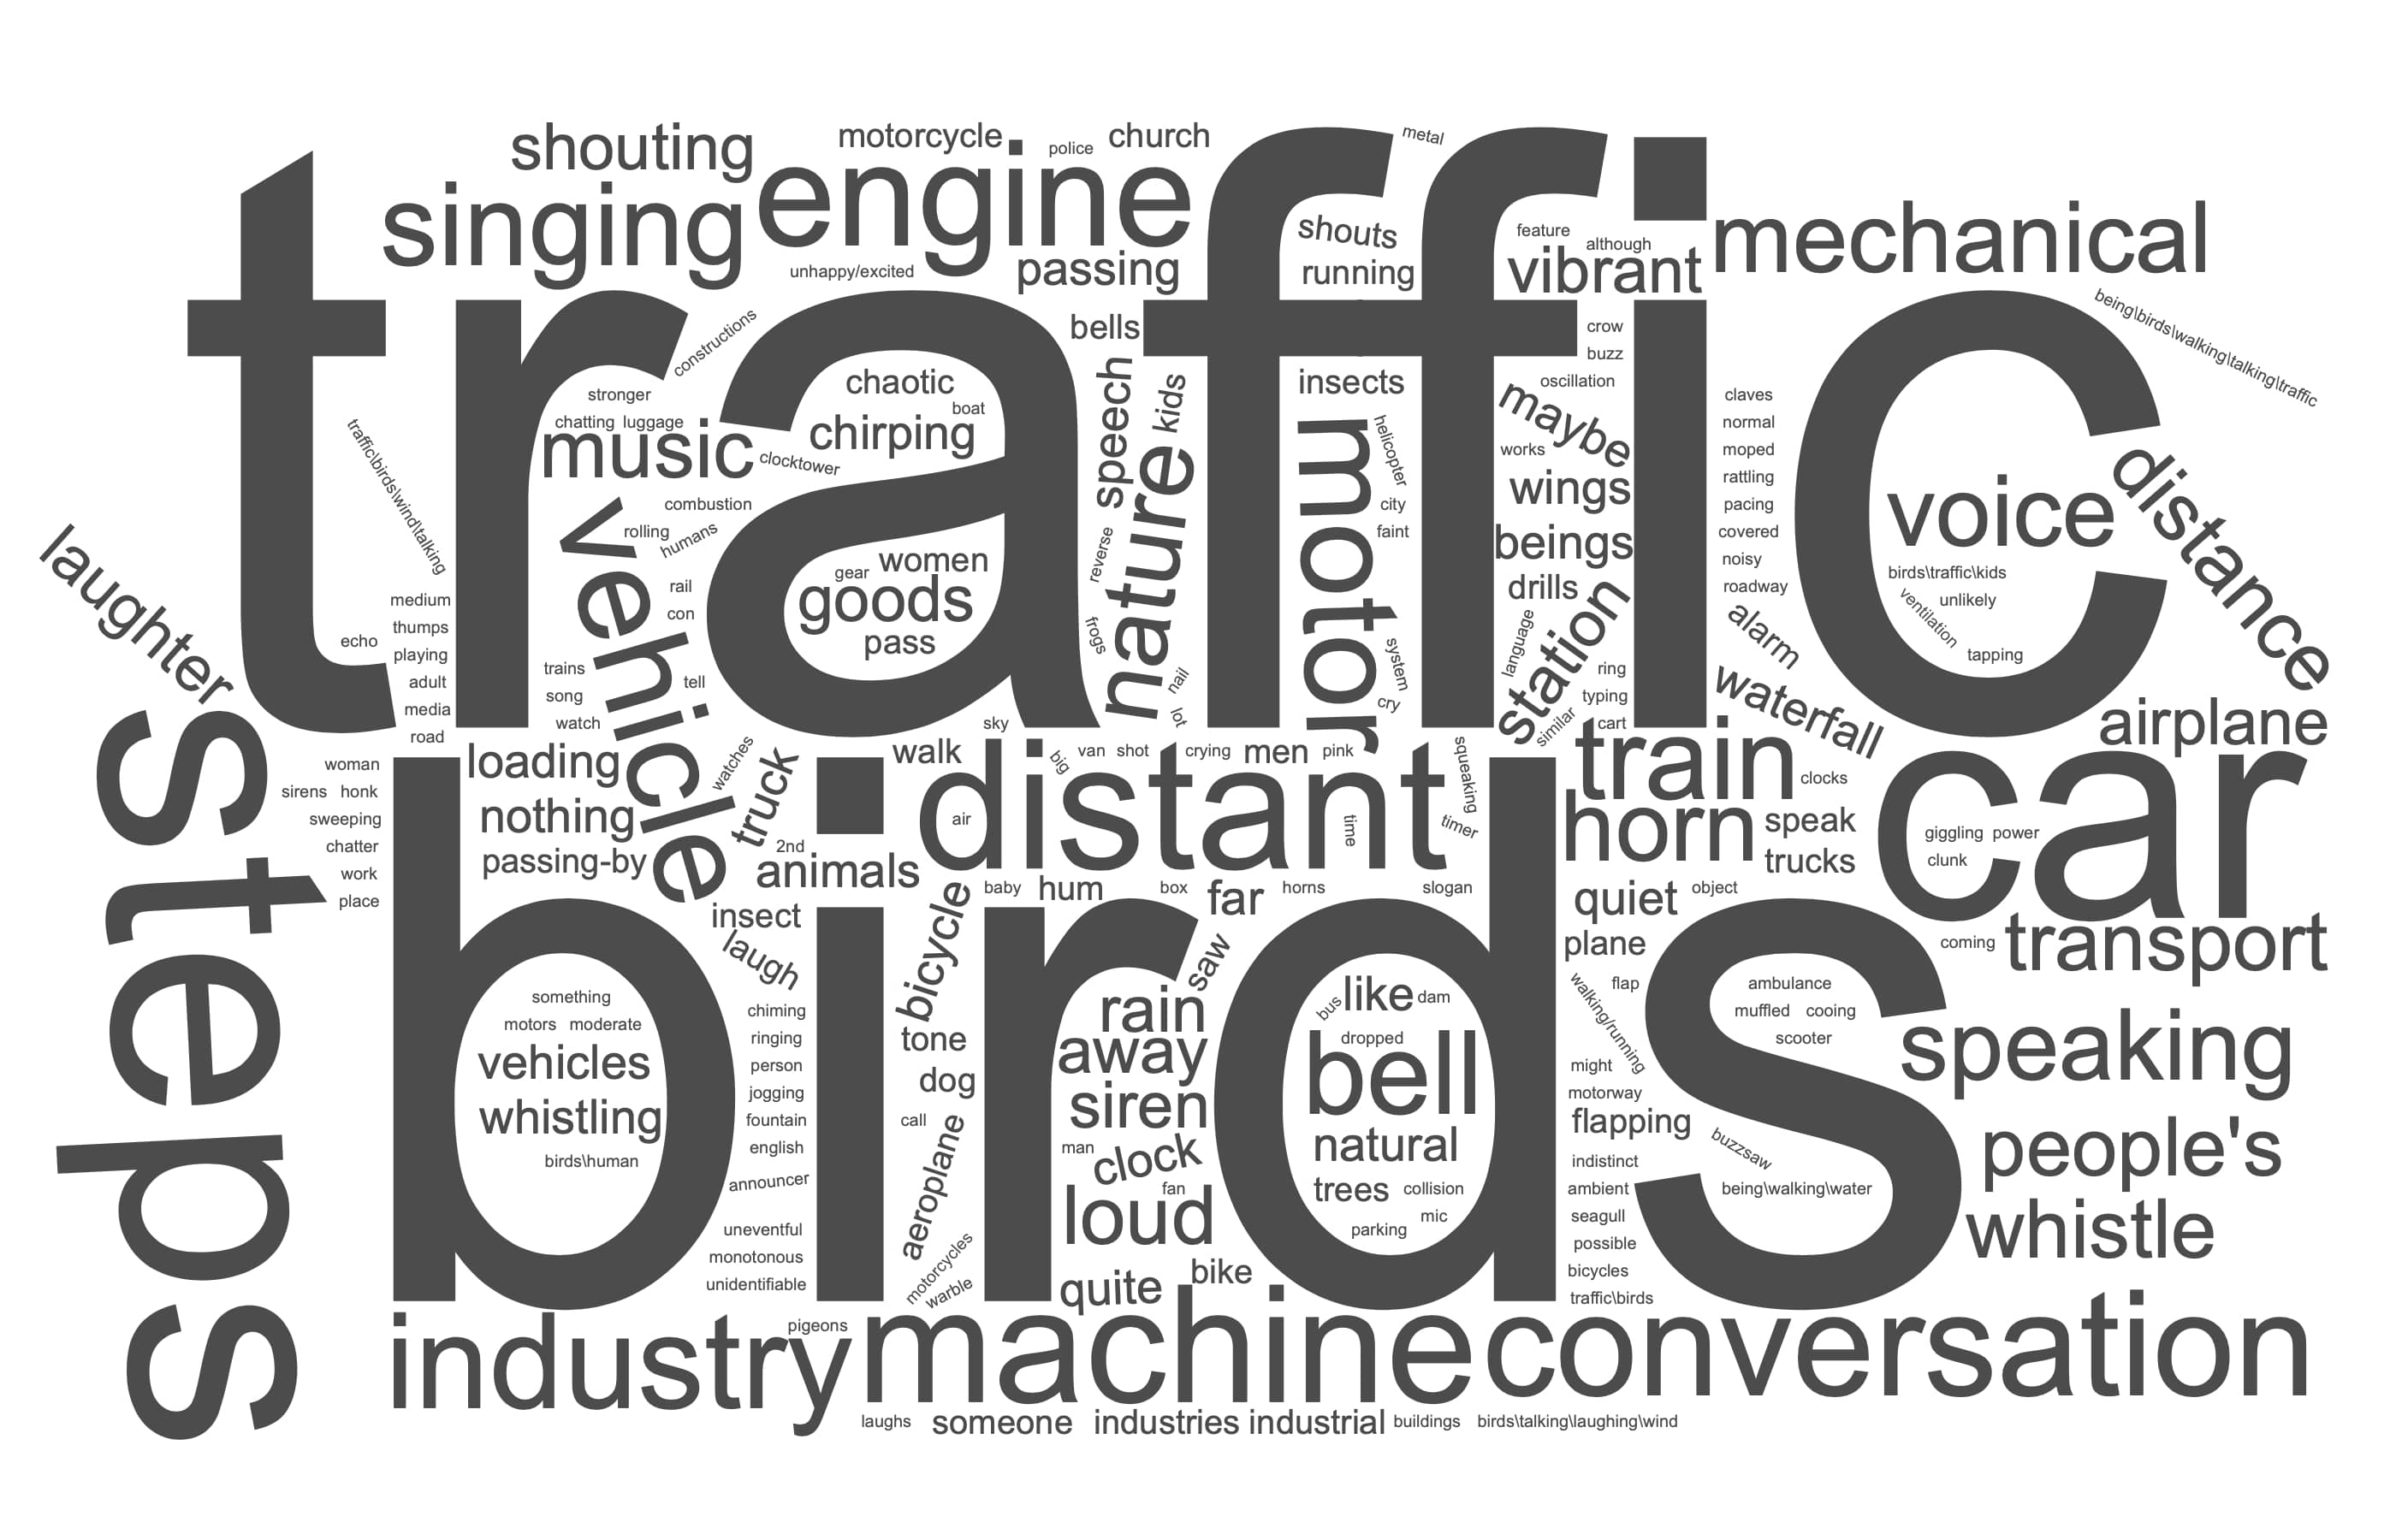
1803 words describing the sound sources present in the 2019 recordings and 1395 words related to the 2020 recordings were input by participants in response to the open-ended question Q1 (see Appendix A). The frequency of occurrence, generated using the WordClouds web app, is shown in the Figure 3, for the 2019 and the 2020 sets respectively. The most frequent words from both 2019 and 2020 groups are: noise, car/traffic, bird/birds, talk/voice and (foot)steps.
The results from the listening tests deployed online were analyzed using the SPSS Statistics v. 25. Levene’s test for equality of variances resulted in highly statistically significant values for all 4 sound sources investigated (less than 0.001). Therefore, a Mann-Whitney U-test test was used as a non-parametric equivalent to the T-test to investigate the change in the perceived dominance of the four sound source types (McKnight and Najab 2010). The results for human sounds indicated that the perceived dominance was greater for the 2019 sample (M=3.82), than for the 2020 sample (M=2.62), U=41,656, p < 0.001. The results for natural sounds indicated the perceived dominance increased from 2019 (M=2.00) to 2020 (M=2.54), U=63,797, p < 0.001. However, the differences for the noise sources (traffic and other) were not statistically significant. The result of these changes is that while Human sounds were the clearly dominant source across the whole dataset in 2019, in 2020 the sound sources are, on average, much more evenly balanced. No single sound source category was identified as frequent across the 2020 dataset.
| Sound source type | Campaign | N | Mean | Standard deviation | Standard error mean |
|---|---|---|---|---|---|
| Traffic | 2019 | 422 | 2.51 | 1.369 | 0.067 |
| 2020 | 383 | 2.56 | 1.525 | 0.078 | |
| Other | 2019 | 422 | 2.00 | 1.182 | 0.058 |
| 2020 | 382 | 2.23 | 1.333 | 0.068 | |
| Human | 2019 | 423 | 3.82 | 1.143 | 0.056 |
| 2020 | 382 | 2.62 | 1.346 | 0.069 | |
| Natural | 2019 | 424 | 2.00 | 1.307 | 0.063 |
| 2020 | 380 | 2.54 | 1.441 | 0.074 |
3.2 Model selection, performance, and application
| ISOPleasant | ISOEventful | |||||
|---|---|---|---|---|---|---|
| Predictors | Estimates | Confidence Interval (CI) | p | Estimates | CI | p |
| (Intercept) | 0.24 | 0.15–0.33 | <0.001 | 0.14 | 0.12–0.16 | <0.001 |
| N5 | −0.06 | −0.10–0.02 | <0.001 | |||
| S | −0.08 | −0.11–0.06 | <0.001 | |||
| FS | −0.02 | −0.05–0.00 | 0.033 | |||
| T | 0.04 | 0.01–0.07 | 0.002 | |||
| L_{Aeq} | 0.14 | 0.11–0.17 | <0.001 | |||
| L_{Ceq}-L_{Aeq} | −0.03 | −0.05–0.00 | 0.052 | |||
| Random effects | ||||||
| \sigma^2 | 0.11 | |||||
| \tau_{00} | 0.03_{LocationID} | |||||
| \tau_{11} | 0.02_{LocationID.L_{Aeq}} | |||||
| 0.00_{LocationID.L_{A10}-L_{A90}} | ||||||
| 0.00_{LocationID.L_{Ceq}-L_{Aeq}} | ||||||
| ICC | 0.90 | |||||
| N | 13_{LocationID} | |||||
| Observations | 914 | 914 | ||||
| MAE train, test | 0.258 | 0.259 | 0.233 | 0.231 |
3.2.1 ISOPleasant model selected
Following the feature selection, the ISOPleasant model (given in Table 4) has N_5 as the fixed effect with a scaled coefficient of -0.06, and L_{Aeq}, L_{A10}-L_{A90}, and L_{Ceq}-L_{Aeq} as coefficients which vary depending on the LocationID. The training and testing MAE are very similar, indicating that the model is neither over- nor under-fitting to the training data (MAE_{train} = 0.258; MAE_{test} = 0.259). The model performs very well at predicting the average soundscape assessment of the locations (R^2_{train} = 0.998; R^2_{test} = 0.85).
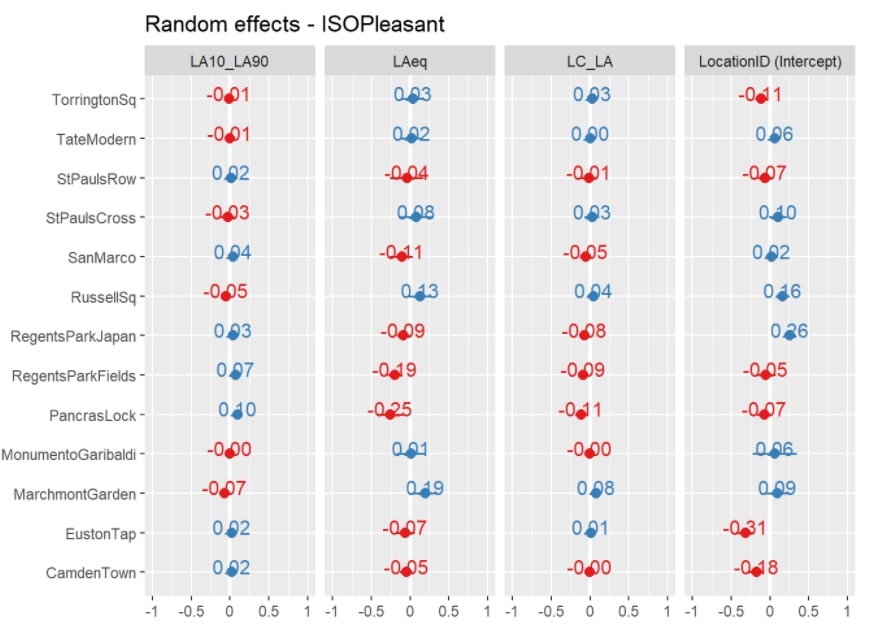
The high intraclass correlation (ICC = 0.90) demonstrates that the location-level effects are highly important in predicting the pleasantness dimension. Within this random-intercept random-slope model structure, these effects include both the specific context of the location (i.e. the LocationID factor), but also the L_{Aeq}, L_{A10}-L_{A90}, and L_{Ceq}-L_{Aeq} features whose effects vary across locations. These slopes are given in Figure 4. This point highlights the need to consider how the context of a location will influence the relationship between the acoustic features and the perceived pleasantness.
3.2.2 ISOEventful model selected
Through the group-level feature selection, all of the group-level coefficients were removed, including the LocationID factor itself. Therefore the final ISOEventful model is a ‘flat’ multi-variate linear regression model, rather than a multi-level model. The ISOEventful model is a linear combination of S, FS, T, L_{Aeq}, and L_{Ceq}-L_{Aeq}. The training and testing MAE are very similar, indicating that the model is not over-fit to the training data (MAE_{train} = 0.233; MAE_{test} = 0.231). The model performs slightly worse than the ISOPleasant at predicting the mean location responses, but still performs well (R^2_{train} = 0.873; R^2_{test} = 0.715).
3.2.3 Application to lockdown data
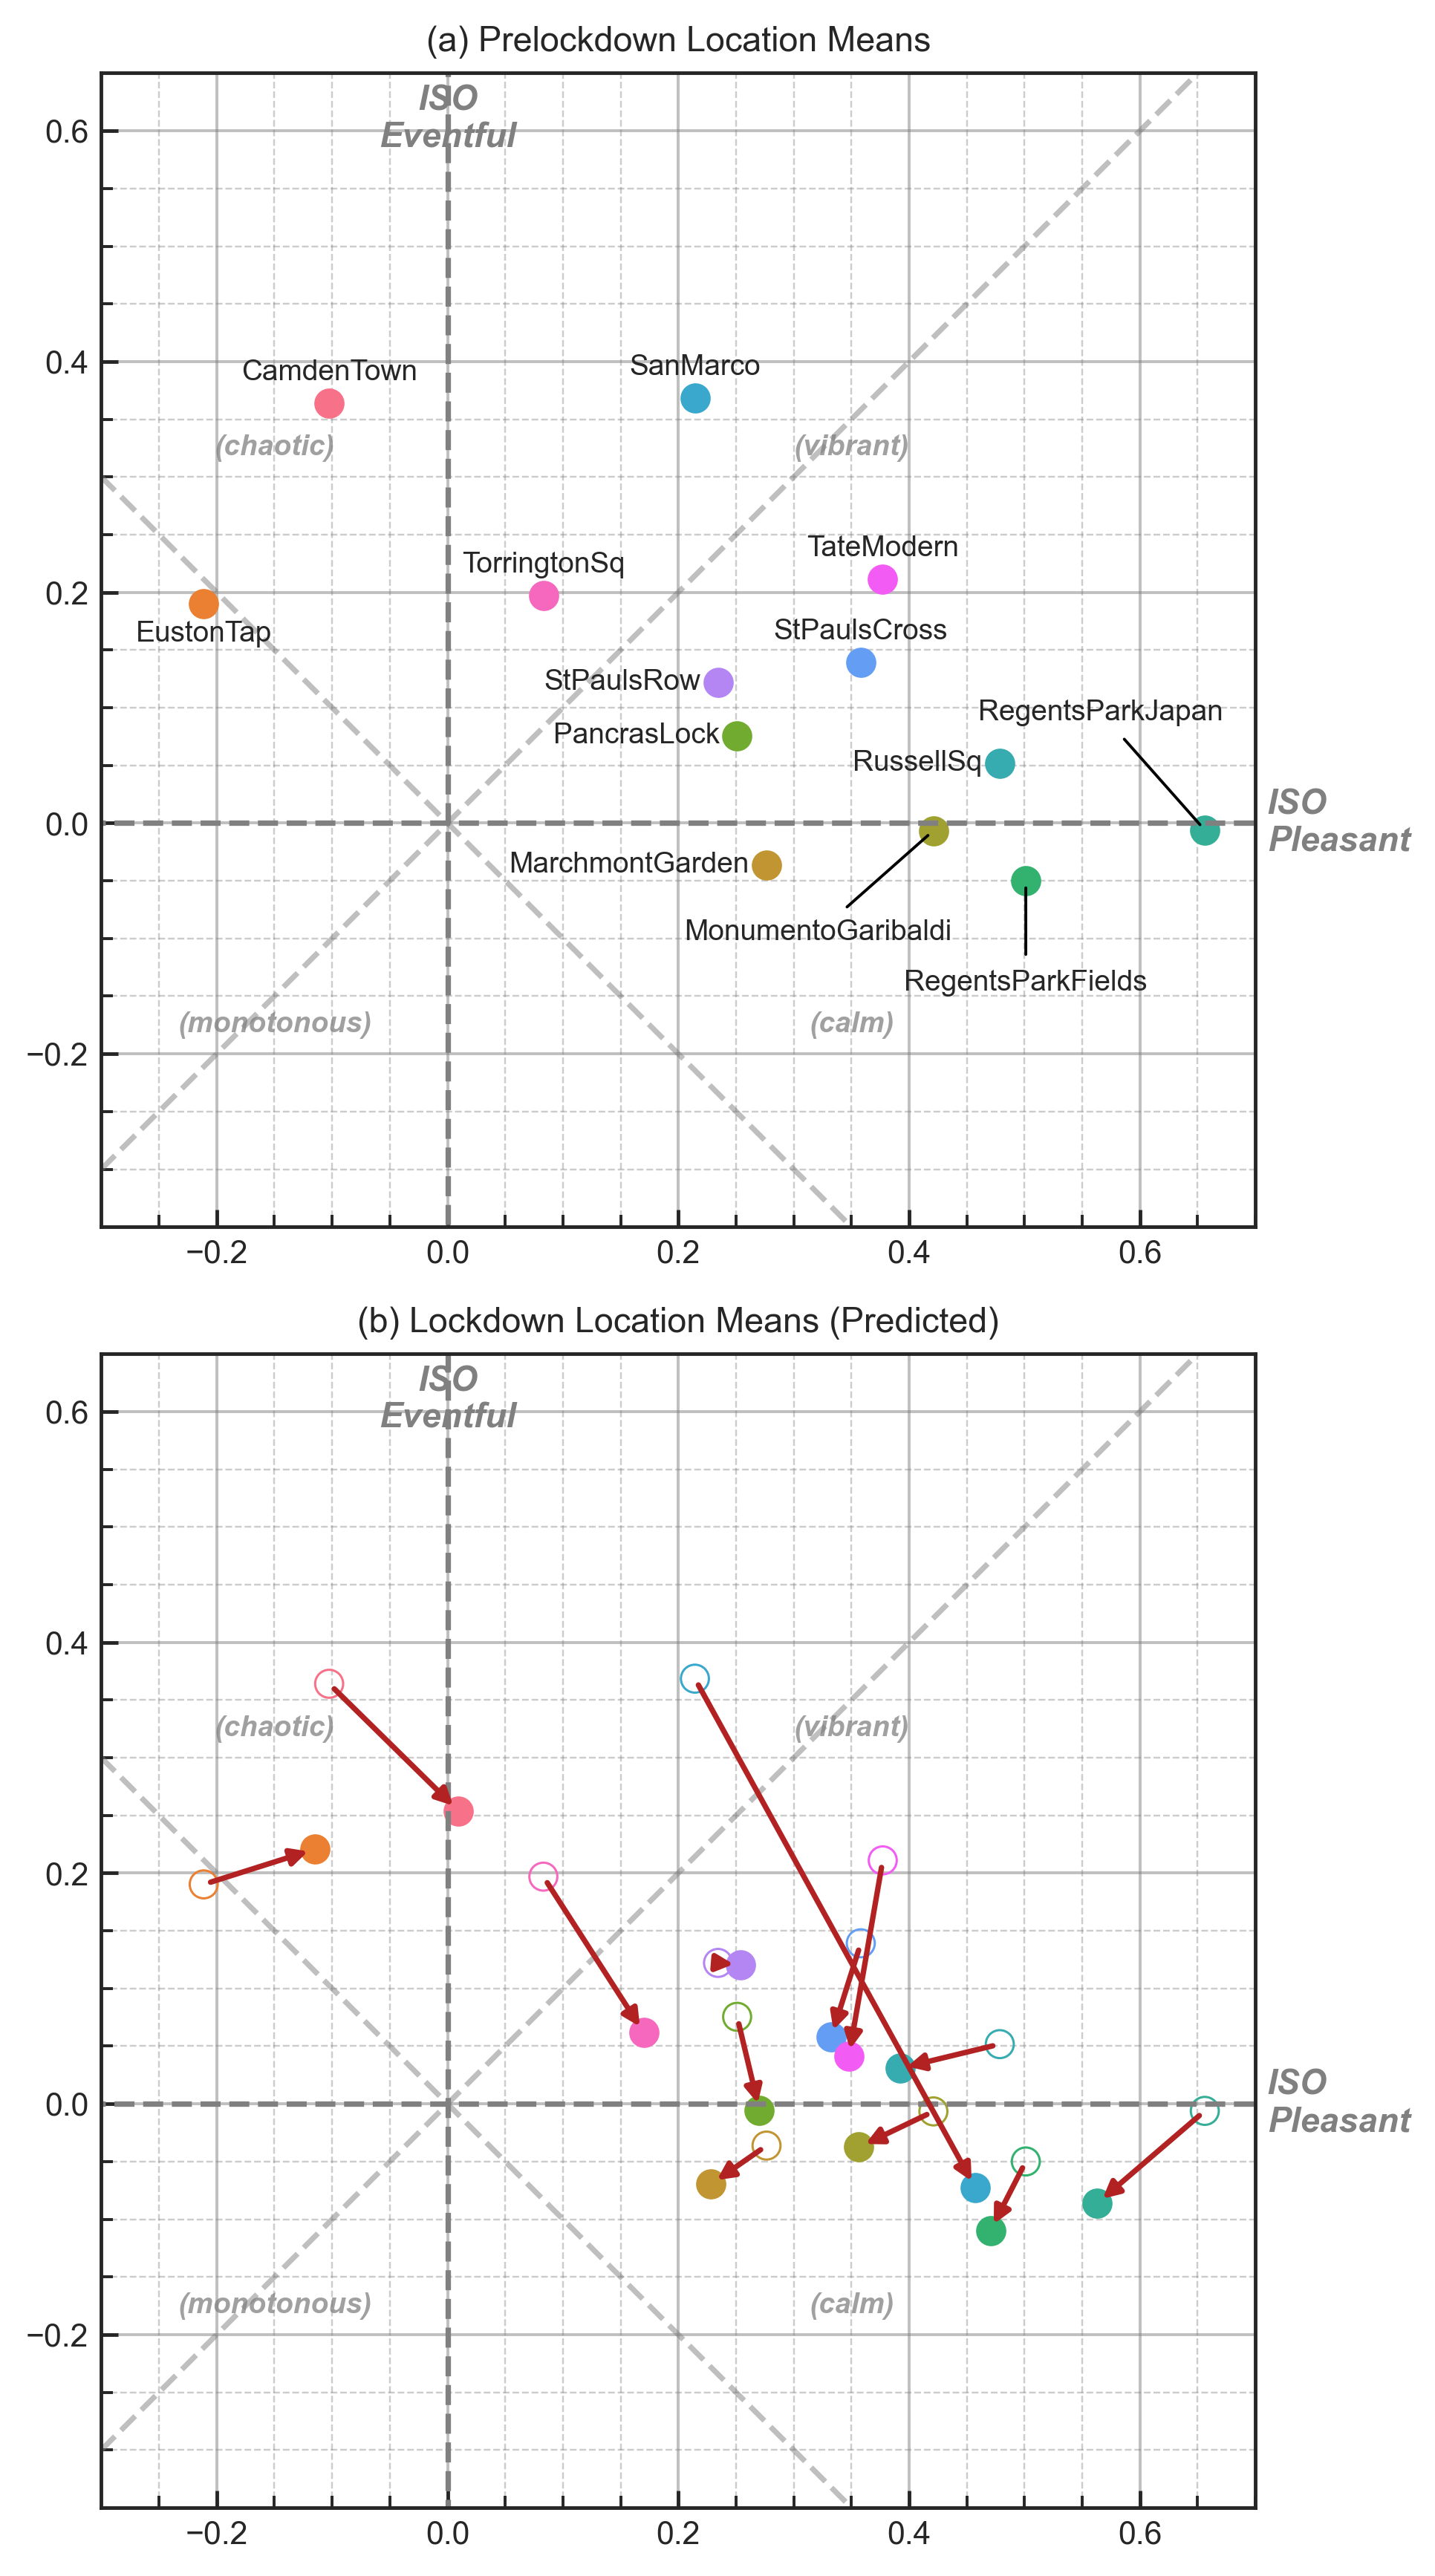
Once the two models were built and assessed, they were then applied to the lockdown recording data in order to predict the new soundscape ISO coordinates. Figure 5 (a) shows the pre-lockdown ISO coordinates for each location and Figure 5 (b) shows how the soundscapes are predicted to have been assessed during the lockdown period. As in the model assessment process, the predicted responses are calculated for each recording individually, then the mean for each location is calculated and plotted on the circumplex.
In 2019 the majority of locations in the dataset fall within the ‘vibrant’ quadrant of the circumplex, particularly those which are primarily dominated by human activity (e.g. San Marco, Tate Modern). Camden Town and Euston Tap, which are both in general visually and acoustically dominated by traffic, are the only two to be rated as ‘chaotic’, while no locations are overall considered to be ‘monotonous’. During the 2020 lockdown, there is general positive move along the ‘pleasant’ dimension and general negative move along the ‘eventful’ dimension, but several different patterns of movement can be noted. These are investigated further in the Discussion section below.
4 Discussion
4.1 Interpretation of the results
To interpret the results addressing the RQ1 and RQ2, it is necessary to separately look into the overall change in sound source composition, and the change in the affective quality of soundscapes per location.
4.1.1 Change in the sound source composition
The open-ended question about sound sources in the online survey did not reveal a change in sound source types but rather confirmed that all types were still present in both conditions. The sound source composition question taken from the Method A of the ISO/TS 12913-2:2018 (2018) revealed a statistically significant reduction in human sound sources and a significant increase in the perceived dominance of natural sound sources.
The most frequent sound sources detected from the open-ended question correspond to the main four sound source types investigated, which indicated that all types remained present in the lockdown condition (at all the locations). While traffic intensity might have gone down, where the results of the Mann-Whitney U-test were inconclusive, but supported by the psychoacoustic measurements (Aletta et al. 2020), traffic-related sound sources were still clearly present.
The sound source composition of an outdoor acoustic environment is extremely complex. Removing one component, such as human sounds, has implications on the whole (Gordo et al. 2021). Testing the effects of this in situ is not straightforward and interpreting this study in line with ‘what is the impact of human sounds’ must be taken within the broader context of the range of conditions which changed within the acoustic environment. However, looking at the overarching picture, the lockdown condition was a useful and unique case study to understand the impact which human activities – and the human sound source type in particular – can have on soundscape perception of urban open spaces.
4.1.2 Predicted relative changes in soundscapes due to COVID-19 restrictions
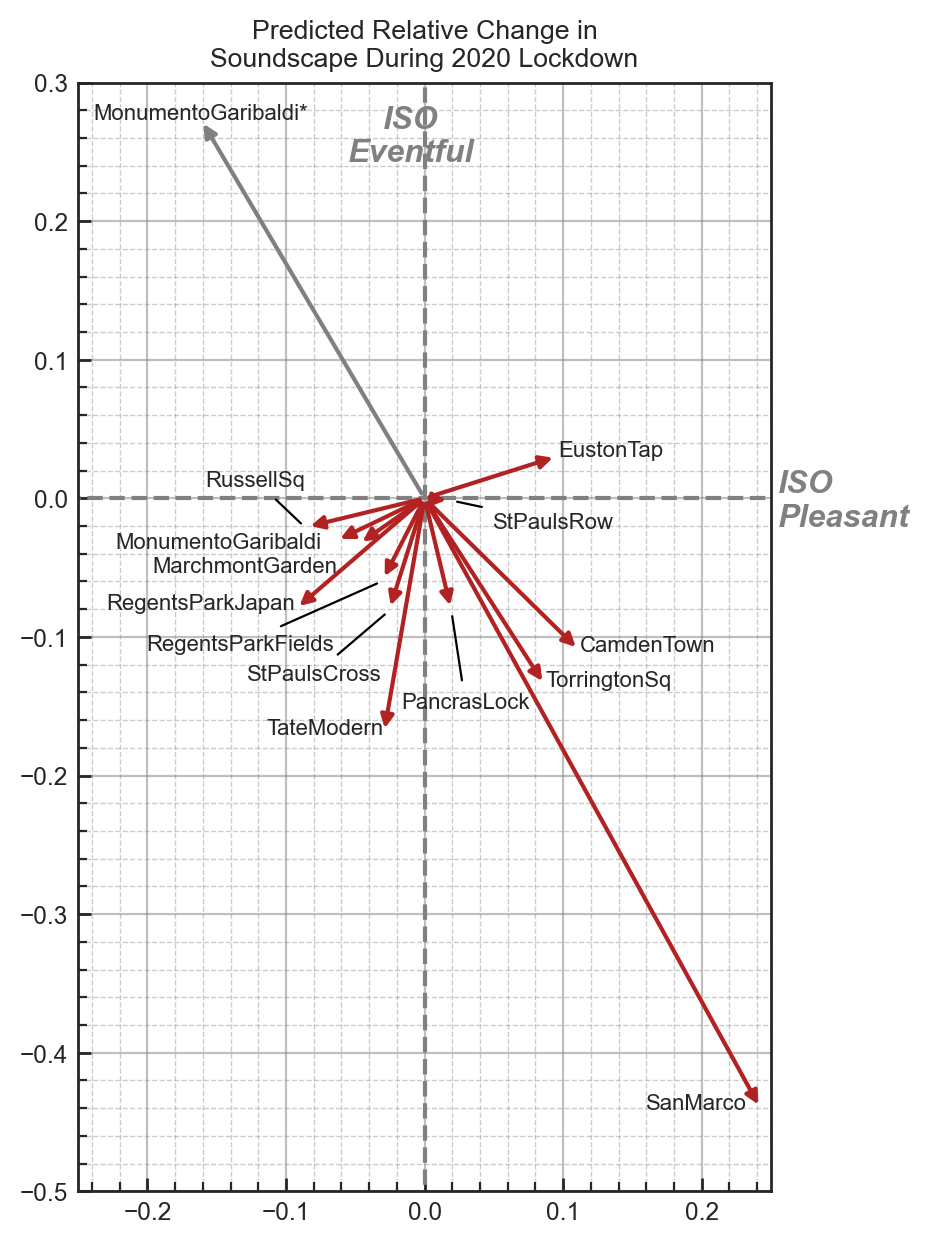
In order to interpret how the change of the acoustic environment at the locations examined would have been perceived, and to answer RQ2, relative change vectors within the circumplex space are shown in Figure . This clearly shows a few different patterns of soundscape change due to the effects of the 2020 lockdown. These can be further looked into depending on the magnitude and direction of change, shifts between quadrants shown in Figure 5, and the sound source composition. The discussion below is organized according to groups of locations which show similar behaviors in the predicted magnitude and direction of change, or discusses a single location which is particularly notable.
4.1.2.1 Piazza San Marco
The largest change is seen in Piazza San Marco, with a predicted increase in pleasantness of 0.24 and a decrease in eventfulness of 0.44, enough to move the soundscape out of the ‘vibrant’ quadrant and into ‘calm’. This extreme change (relative to the rest of the locations) is exactly what would be expected given the unique context of the measurements taken in 2019 – the measurement campaign corresponded with Carnevale, a yearly festival which centers around the square. By contrast, due to the particularly strict measures imposed in Italy, during the lockdown measurement period, the square was almost entirely devoid of people. What is promising is that, without any of this contextual information about the presence or absence of people, our model is able to capture and reflect what may be considered a reasonable and expected direction and scale of change within the soundscape circumplex.
4.1.2.2 Locations showing an increase in pleasantness
The next locations of interest are those which, in the 2019 survey data, were rated as being dominated by traffic noise: Euston Tap, Camden Town, Torrington Square, and Pancras Lock. These are the only locations (besides San Marco) which show a predicted increase in pleasantness. Of these traffic-dominated spaces, the two which were most heavily dominated by traffic noise (Camden Town and Euston Tap) showed the most increase in pleasantness, with Torrington Square having slightly less of an increase. Pancras Lock, which was also rated as having high levels of both Human and Natural sounds shows only a modest improvement in pleasantness.
4.1.2.3 Locations showing a decrease in pleasantness
Among the locations which are predicted to experience a negative effect on pleasantness we see a mix of spaces which were assessed as being dominated by Human (St Pauls Cross and Tate Modern) and Natural (Regents Park Japan, Regents Park Fields, Russell Square) sounds before the lockdown. It is hard to discern a pattern of difference between these two groups, although it appears that the Human-dominated spaces saw a greater reduction in eventfulness, compared to the Natural-dominated spaces.
In general, we note that most of the spaces experience some degree of reduction in eventfulness. This pattern is particularly consistent with what would be expected from a reduction in human presence in these spaces (Aletta and Kang 2018), as reflected by the observation that, in general, those spaces which had the most human sounds prior to the lockdown showed the greatest reduction in eventfulness during the lockdown. In particular, Tate Modern, Camden Town, and Torrington Square show the greatest reduction in eventfulness. This appears to be due to these locations showing the greatest reduction in overall L_{Aeq} compared to other locations (8.1 dB, 5.2 dB, and 9.2 dB, respectively), with L_{Aeq} being the most influential feature in the eventfulness model, as shown in Table 4. However, Russell Square also experienced a large decrease in L_{Aeq} on average (10.5 dB) but does not show the same reduction in eventfulness. This appears due to the correspondingly large decrease in S (1.17 acum) which is not seen at the 3 previously mentioned locations. Russell Square normally features a medium-sized jet fountain which was turned off during the lockdowns in 2020 and therefore it experienced a drop in the overall sound level, but an increase in the proportion of low frequency noise to high frequency noise reflected by a decrease in sharpness which, within the eventfulness model, effectively cancels out the impact of the reduction in L_{Aeq}. While the overall sound level has an important impact, in order to determine the true impact a reduction in sound level may have, it must be taken in context with how the other aspects of the sound will also change.
4.1.2.4 Euston Tap
An unexpected result is that Euston Tap is predicted to experience an increase in eventfulness and it is unclear whether this accurately reflects the real experience people would have had in the space. Normally, Euston Tap is a mostly-outdoor drinking venue located at the entrance to London Euston Station and situated directly along a very busy central London road. During the 2020 survey, the researchers noted that the music and chatter of people from the pub was noticeably missing, but that the perceived reduction in road traffic was minimal. Based on the theory of vibrancy which would suggest it is driven by human presence and sounds (Aletta and Kang 2018), we would not therefore expect a shift in the vibrant direction as indicated here. This discrepancy may reveal a weakness in the context-independent ISOEventful model, or it may in fact be indicating that, at certain thresholds of traffic noise, a reduction in level – and therefore a reduction in energetic masking – will allow other aspects of the sound to influence the perception.
4.1.2.5 Monumento Garibaldi
Finally, special attention should be paid to the results shown for Monumento Garibaldi, which in 2019 was perceived as a pleasant and slightly calm green space featuring a gravel walkway. During the first measurement session during the lockdown in 2020, the researcher noted that the soundscape was dominated by landscaping works, in particular noise from strimmers (or weed whackers). In order to gain a sample which was more representative of the impact of the lockdowns, the researcher returned another day to repeat the measurements without interference from the works.
To examine the impact of these two scenarios separately, the prediction model was fitted to the data from the two sessions independently and the session which was impacted by the landscaping works is shown in Figure 6 in gray and labeled MonumentoGaribaldi*, while the unaffected session is shown in red. In the latter case, the predicted change in soundscape as a result of the lockdown fits neatly into what would be expected and closely matches the predicted behavior of similar locations in London (i.e. Marchmont Garden and Russell Square). On the other hand, the session which was dominated by noise from the strimmers is predicted to have become much more chaotic, with a decrease in pleasantness of 0.16 and an increase in eventfulness of 0.27. This indicates that, although the model has no contextual information about the type of sound and in fact the training data never included sounds from similar equipment, just based on the psychoacoustic features of the sound it is able to reasonably predict the expected change in soundscape.
4.1.2.6 General notes
As a whole, the primary impact of the 2020 lockdowns on the soundscapes in London and Venice was an overall decrease in eventfulness. With the exception of Euston Tap, all of the sessions show some degree of reduction in eventfulness, reflecting the general decrease in sound levels and human sound sources across the locations. The impact of the lockdowns on pleasantness is more mixed and seems to be driven by the previous dominance of traffic noise in the space. However, it could also be noted that, while all locations experienced a reduction in sound level, those which are predicted to become more pleasant had an average L_{Aeq} above 60 dB in 2019. By contrast, the locations which were predicted to experience a decrease in pleasantness generally had sound levels below 60 dBA in 2019. This may indicate that reductions in sound level can improve pleasantness when the sound level exceeds some threshold of around 60 - 65 dBA but are ineffective when sound levels are below this threshold. Similarly, Yang and Kang (2005) showed that, when the sound level is ‘lower than a certain value, say 70 dB’ there is no longer a significant improvement in the evaluation of acoustic comfort as the sound level reduces. It is unclear at this point where this threshold would lie for pleasantness/annoyance, how strict it may be, or how it is impacted by the sound source composition of the acoustic environment, therefore further research is needed in this area.
4.1.3 Model selection results
The most immediately interesting result of the model-building and feature selection process, answering to RQ3, is the apparent irrelevance of location context to the ISOEventful dimension. The multilevel model structure was chosen since the starting assumption was that soundscape perception is heavily influenced by contextual factors, such as expectations of the space and visual context (Ricciardi et al. 2015). For this modeling, these factors can be considered as location-level latent variables at least partially accounted for by the inclusion of the LocationID as the second-level factor. While this assumption certainly held true for ISOPleasant, our results indicate that these types of contextual factors are not significant for ISOEventful, and do not affect the relationship between the acoustic features of the sound and the perception.
In particular this result may herald a shift in modeling approach for soundscapes – where previous methods, in both the soundscape and noise paradigms, have mostly focused on deriving acoustic models of annoyance (in other words have focused on the ISOPleasant dimension) perhaps they should instead consider the acoustic models as primarily describing the eventfulness dimension when considered in situ. In addition this study takes the approach of modeling responses at an individual level in order to derive the soundscape assessment of the location. Rather than either attempting to represent the predicted response of an individual person – which is less useful in this sort of practical application – or to base the model on average metrics of the location, the goal is instead to characterize the location itself, through the aggregated predicted responses of individuals. The authors believe this modeling approach better addresses the practical goal of predictive soundscape modeling and reflects the structure of the data collection.
4.2 Limitations of the study
The onsite sampling method was initially not intended as the ultimate characterization of a location’s soundscape but rather as a tool for model development. Therefore, the change observed does not necessarily represent the ground truth about the site’s soundscape, if such a thing exists. Further, the online listening tests took a relatively small but random sample from the available database and did not include any contextual information. This proved to be sufficient for the purpose of detecting a change in sound source composition, however the relatively small sample of recordings included in the online study does limit how representative they are of the location’s sound environment as a whole. Similarly, the surveys and recordings taken represent only a snapshot of the soundscape or sound environment for a short period in time. This is a flaw in most soundscape sampling methods presented both in the literature and in ISO/TS 12913-2. To truly be said to characterize the soundscape of a space, long-term monitoring and survey methods will need to be developed in order to capture the changing environmental and contextual conditions in the space. Models of the sort presented here, which are based on measurable quantities, could prove to be useful in this sort of longterm monitoring as they could take continuous inputs from sensors and generate the likely soundscape assessment over time.
The audio-visual interaction forms a key component in people’s perception of urban spaces. This consideration has been a strength of soundscape research and has been incorporated via the use of in situ data collection. However, the visual aspect, and in particular how the visual environment changed as a result of the lockdown condition, was not considered in this study, reducing the comprehensiveness of the model. This was due primarily to data collection limitations imposed by the lockdown restrictions which made it impractical to replicate the 360^{\circ} videos made during the 2019 sessions. Future work on comprehensive predictive soundscape models should strive to make use of this visual aspect within their considered features.
The limitation of the sound source categorization adopted from the ISO standard is that it may not be clear to a respondent in which category they would place community sounds like church bells and music. This may be particularly relevant for comparing the lockdown condition, as in particular the ringing of bells for worship varied in different contexts throughout the pandemic. Whether bells ceased entirely or were increased not only would have an impact on the sound environment, but the purposeful action behind the decision to ring bells may have changed to public’s relationship to and perception of the sound itself (Parker and Spennemann 2020). The open ended question on sound sources, however, revealed the presence of church bells in both years. Unfortunately, this is a limitation of the sound source categories given by the ISO standard on which this questionnaire was based. A sensible update based on the findings and experiences reported here would be to combine the Traffic and Other Noise categories as separating them does not appear to provide additional information, and to include a new category which would in some way encapsulate the types of community sounds for which there is currently not a clear category.
Further, the lockdown condition is likely to cause distortions of the circumplex soundscape perception model. Therefore, it is important to acknowledge that all the predictions were made for the people with no experience of the pandemic and its psychological effects. Conceptually, this model captured the perceptual mapping (i.e. the relationship between the acoustic indicator inputs and the soundscape descriptor outputs) of people in 2019, but this perceptual mapping is likely to have been affected by the psychological and contextual impacts of the lockdown itself, independent of its changes on the sound environment. Future research might look into potential perception changes in the post-pandemic world.
5 Conclusion
This study demonstrates an application of predictive modeling to the field of soundscape studies. The model building results reveal that, within this dataset, an approach based on psychoacoustics can achieve R^2 = 0.85 for predicting the pleasantness of locations and R^2 = 0.715 for predicting the eventfulness. A modeling–focused method of this sort is a key component to the potential scalability of the soundscape approach to applications such as smart city sensing, urban planning, and cost-effective, sustainable design. To demonstrate the usefulness and feasibility of such an approach, we apply our predictive model to a unique case study in which traditional soundscape survey methods were impossible.
By applying this predictive model to recordings collected during the 2020 lockdown, the change in perception of the urban soundscapes is revealed. In general, soundscapes became less eventful, and those locations which were previously dominated by traffic noise became more pleasant. By contrast, previously human- and natural-dominated locations are in fact predicted to become less pleasant despite the decrease in sound levels. While all sound source categories remained present in both years, overall, in 2020 a decrease in human sounds’ dominance was observed together with an increase in the perceived dominance of natural sounds. Although these results are limited in that they represent one snapshot of the soundscape of the spaces, the success of the model in responding to new and disturbing sound events demonstrates its potential usefulness in long-term monitoring of urban soundscapes.
Acknowledgements
This project has received funding from the European Research Council (ERC) under the European Union’s Horizon 2020 research and innovation program (Grant Agreement No. 740696, project title: Soundscape Indices – SSID). More information and related publications can be found at the CORDIS webpage of the project7.
The authors would like to thank Zhongzhe Li for conducting binaural recordings at Euston Square Gardens and Torrington Square in 2019. The authors would like to thank Meihui Ba, Nicolas Assiotis, Veronica Rugeles Allan, Yu Wang and Hua Su for their help in conducting on-site surveys during the spring and the autumn of 2019.
On-site study data were collected and managed using REDCap electronic data capture tools hosted at University College London (UCL).
Appendix A: Online survey questionnaire
| Q1 | While listening, please note any sound sources you can identify in this sound environment |
| Q2 | To what extent have you heard the following four types of sounds? |
| Traffic noise (e.g., cars, buses, trains, airplanes) | |
| Not at all / A little / Moderately / A lot / Dominates completely | |
| Other noise (e.g., sirens, construction, industry, loading of goods) | |
| Not at all / A little / Moderately / A lot / Dominates completely | |
| Sounds from human beings (e.g., conversation, laughter, children at play, footsteps) | |
| Not at all / A little / Moderately / A lot / Dominates completely | |
| Natural sounds (e.g., singing birds, flowing water, wind in vegetation) | |
| Not at all / A little / Moderately / A lot / Dominates completely |
Appendix B: Model Results
Table 6 presents the unscaled coefficients for the ISOPleasant and ISOEventful predictive models. The scaled coefficients are presented in the body of the text to facilitate comparisons between the various factors. However, we feel it is important to present unscaled coefficients such that these models could be implemented and compared for future work.
| ISOPleasant | ISOEventful | |||||
|---|---|---|---|---|---|---|
| Predictors | Estimates | Confidence Interval (CI) | p | Estimates | CI | p |
| (Intercept) | 0.38 | 0.28–0.50 | <0.001 | -0.77 | -1.05-0.48 | <0.001 |
| N5 | −0.01 | −0.01–0.00 | <0.001 | |||
| S | −0.17 | −0.23–0.12 | <0.001 | |||
| FS | −1.36 | −2.61–0.11 | 0.033 | |||
| T | 0.24 | 0.08–0.39 | 0.002 | |||
| L_{Aeq} | 0.02 | 0.08–0.29 | <0.001 | |||
| L_{Ceq}-L_{Aeq} | −0.01 | −0.02–0.00 | 0.052 | |||
| Random effects | ||||||
| \sigma^2 | 0.11 | |||||
| \tau_{00} | 1.01_{LocationID} | |||||
| \tau_{11} | 0.00_{LocationID.L_{Aeq}} | |||||
| 0.00_{LocationID.L_{A10}-L_{A90}} | ||||||
| 0.00_{LocationID.L_{Ceq}-L_{Aeq}} | ||||||
| ICC | 0.90 | |||||
| N | 13_{LocationID} | |||||
| Observations | 914 | 914 |
References
Footnotes
See https://zenodo.org/record/5654747 for “The International Soundscape Database (V0.2.1)” (Last viewed 11/9/21)↩︎
See supplementary material at https://www.scitation.org/doi/suppl/10.1121/10.0008928 for site descriptions per ISO/TS (2018) featuring the address, overall psychoacoustic characteristics of the location, typical use of each location, and pictures taken during the survey sessions.↩︎
See https://zenodo.org/record/5654747 for “The International Soundscape Database (V0.2.1)” (Last viewed 11/9/21)↩︎
See (<www.gorilla.sc>) (Last viewed 11/29/21)↩︎
See https://cordis.europa.eu/project/rcn/211802/factsheet/en (Last viewed 12/7/21)↩︎
Reuse
Citation
@article{mitchell2021,
  author = {Mitchell, Andrew and Oberman, Tin and Aletta, Francesco and
    Kachlicka, Magdalena and Lionello, Matteo and Erfanian, Mercede and
    Kang, Jian},
  title = {Investigating Urban Soundscapes of the {COVID-19} Lockdown:
    {A} Predictive Soundscape Modeling Approach},
  journal = {J. Acoust. Soc. Am.},
  volume = {150},
  number = {6},
  pages = {4474-\/-4488},
  date = {2021-12-28},
  url = {https://pubs.aip.org/asa/jasa/article/150/6/4474/995506/Investigating-urban-soundscapes-of-the-COVID-19},
  doi = {10.1121/10.0009794},
  langid = {en},
  abstract = {The unprecedented lockdowns due to COVID-19 in spring 2020
    triggered changes in human activities in public spaces. A predictive
    modeling approach was developed to characterize the changes in the
    perception of the sound environment when people could not be
    surveyed. Building on a database of soundscape questionnaires
    (\$N=1,136\$) and binaural recordings (\$N=687\$) collected in 13
    locations across London and Venice during 2019, new recordings
    (\$N=571\$) were made in the same locations during the 2020
    lockdowns. Using these 30-second-long recordings, linear multi-level
    models were developed to predict soundscape pleasantness
    (\$R\^{}2=0.85\$) and eventfulness (\$R\^{}2=0.715\$) during the
    lockdown and compare changes for each location. Performance was
    above average for comparable models. An online listening study also
    investigated the change in sound sources within the spaces. Results
    indicate: 1) human sounds were less dominant and natural sounds more
    dominant across all locations; 2) contextual information is
    important for predicting pleasantness but not for eventfulness; 3)
    perception shifted towards less eventful soundscapes and to more
    pleasant soundscapes for previously traffic-dominated locations, but
    not for human- and natural-dominated locations. This study
    demonstrates the usefulness of predictive modeling and the
    importance of considering contextual information when discussing the
    impact of sound level reductions on the soundscape.}
}